Charts
Fractal Chaos Bands (FCB)
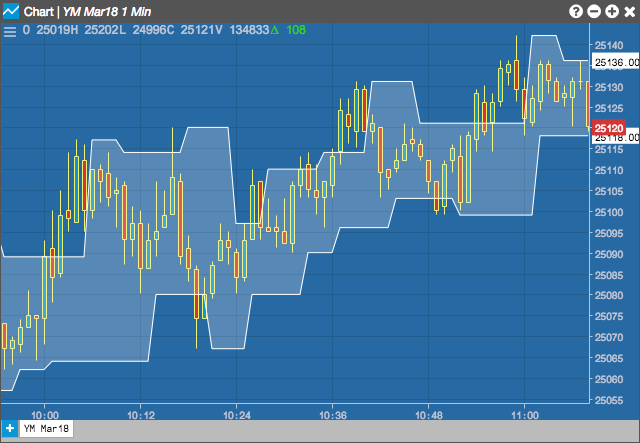
The Fractal Chaos Bands (FCB) indicator looks back in time depending on the number of time periods trader selected to plot the indicator. The upper fractal line is made by plotting an instrument's high prices and the lower fractal line is made by plotting price lows. Essentially, the Fractal Chaos Bands show an overall panorama of the price movement by filtering out the insignificant price fluctuations.
Configuration Options
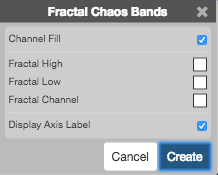
- Channel Fill: Whether to shade the region between the curves.
- Color Selectors: Colors to use for graph elements.
- Display Axis Label: Whether to display the most recent value on the Y axis.