Charts
Elder Impulse System
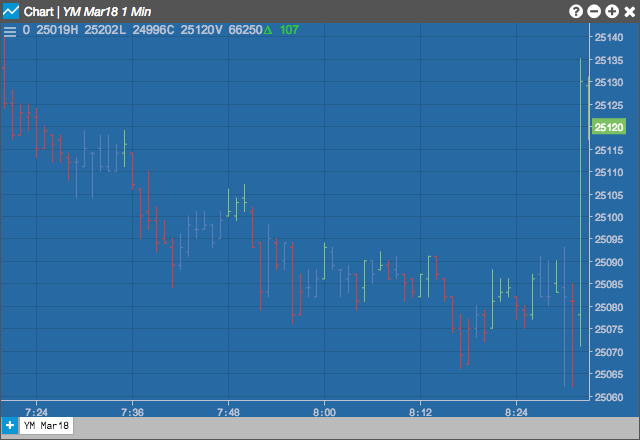
The Elder Impulse System indicator identifies transitions where a trend speeds up or slows down. The Impulse System is based on two indicators, a exponential moving average over a number of days and the MACD histogram. The moving average identifies the trend, while the MACD histogram measures momentum. As a result, the Elder Impulse System combines trend following and momentum to show tradable impulses.
Configuration Options
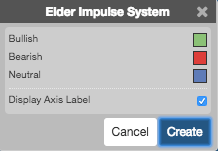
- Color Selectors: Colors to use for graph elements.
- Display Axis Label: Whether to display the most recent value on the Y axis.
Formula
-
Bullish price bar:
(13-period EMA > previous 13-period EMA) and
(MACD-Histogram > previous period's MACD-Histogram) -
Bearish price bar:
(13-period EMA < previous 13-period EMA) and
(MACD-Histogram < previous period's MACD-Histogram) - Neutral price bar: when conditions for a bullish price bar or bearish price bar are not met.