TT Order Types
Using TT TWAP to Drive TT Autospreader Instruments
The TT Time Weighted Average Price (TWAP) synthetic order type may be used to fill large orders when a trader wants to keep the executed trade price as close as possible to the average market price without alerting other market participants to order volume. TT TWAP supports the ability to drive TT Autospreader instruments in addition to an exchange's native contracts.
Case Study Overview
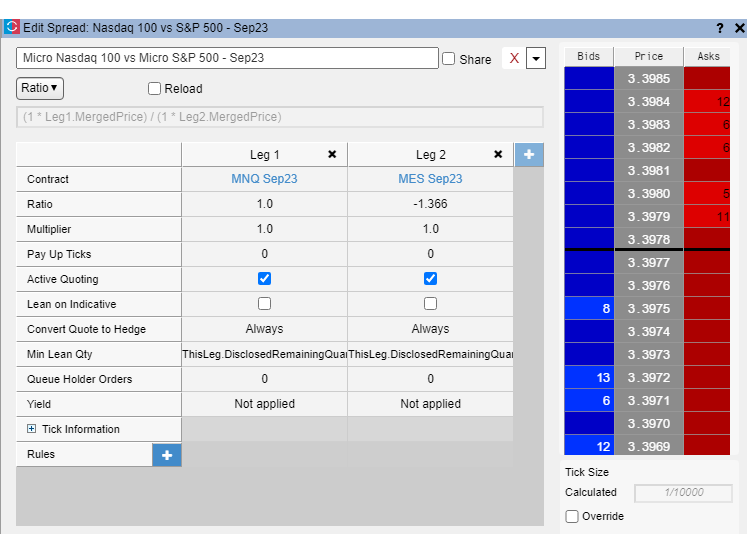
In this case study, a fund manager believes the U.S. Technology sector is undervalued relative to the broader market and uses a ratio spread using CME Index Futures to reflect this view. Using TT Autospreader, the fund manager looks to buy Micro E-Mini Nasdaq 100 Futures while simultaneously selling Micro E-Mini S&P 500 Futures.
Spreads can be profitable in rising or falling markets. In this example, if the Technology sector, (as measured by the Nasdaq 100 Index) outperforms the index for large cap stocks (as measured by the S&P 500 Index), the spread should show a profit.
To reduce market impact while seeking a fill price that averages across the course of the day, the fund manager decides to use the TT TWAP order type.
Constructing the Spread
First, the fund manager must determine the spread ratio. This equals the 'weighting' of each leg of the spread. In this example, the fund manager bases the spread ratio on the notional value of the futures contracts.
Using the following values:
Micro E-mini Nasdaq 100 Futures
Contract unit: $2 x Micro Nasdaq-100 Index (MNQ Sep23 @ 15351.00)
15351.00 x $2.00 = $30,702
Micro E-mini S&P 500 Futures
Contract unit: $5 x S&P 500 Index (MES Sep23 @ 4492.50)
4492.50 x $5.00 = $22,462.5
Results in the following calculation:
Spread Ratio = $30,702 divided by $22,462.5 = 1.366
This implies a ratio of 1 by 1.366 meaning that for each contract of E-mini Nasdaq-100 Futures that is bought, 1.366 contracts of E-mini S&P 500 Futures must be sold.

Calculating Order Size
The fund manager seeks an approximate exposure of $1,000,000. The margin requirements for this position is included in the Margin Requirements section below.
Based on the notional values of each of the calculated futures contracts, the fund manager trades 33 units of the spread configured in the previous step.
33 x Micro EMini Nasdaq 100 ($30,702) = $1,013,166
45 x EMini S&P 500 ($22,462.5) = $1,010,812 (33 x 1.366)
Configuring TT TWAP
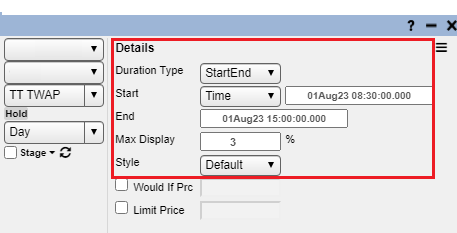
The fund manager wants to align the order with the trading hours of the equities cash session and sets the start and end time accordingly by selecting StartEnd from the Duration Type dropdown and keying in the desired times and dates.
In this example, the overall duration of the order will be 6 hours and 30 minutes (390 minutes).
A Max Display setting of 3% is chosen to ensure a quantity of 1 is used for each native exchange order. This value equals the total order quantity of 33 divided by 100 percent. The more frequently the orders enter the market; the closer the price will be to the average price across the duration of the order.
The Style of execution can be set to either Aggressive, Default, or Passive. In this example, the fund manager chooses Default to minimize the need to cross the market to achieve fills. More details on the behavior of each style can be found in the Time Weighted Average Price Order Parameters section of the help.

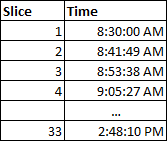
Based on the Duration, Max Display, and Style configured, TT TWAP releases an order for 1 unit of the spread approximately every 11 minutes and 49 seconds. This value equals the total order quantity of 33 divided by the total time of 390 minutes.

Executing the Order
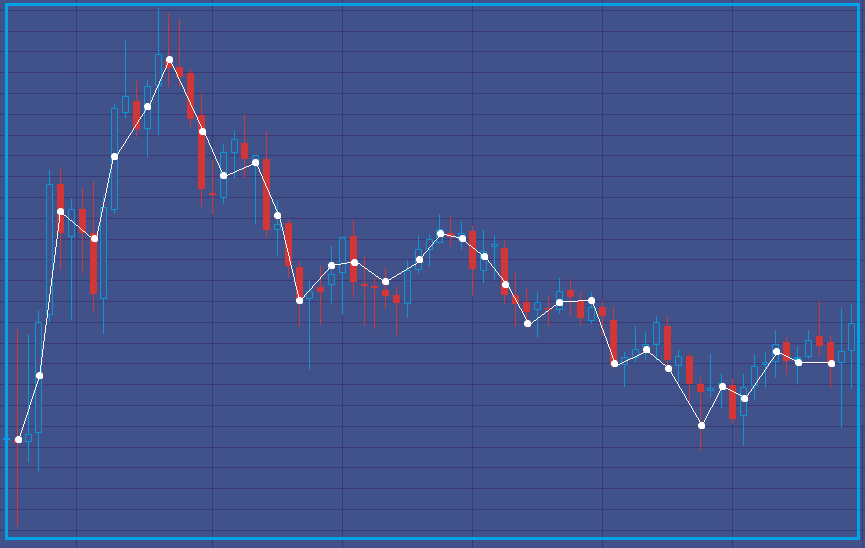
The 5-minute chart below is based on the spread price during the trading session and provides a visual representation of how an average execution price can be achieved using TT TWAP.
Each white dot is a fill towards completing the order for 33 units of the spread and shows how TT TWAP tracks the market. By submitting smaller quantity orders more frequently, the fund manager can better capture the average price across the duration of the order.

Trade Scenarios
Entry Price Scenario
Calculated Spread Price - 3.417
Note The calculated spread price equals the price of Micro E-Mini Nasdaq futures divided by the price of Micro E-Mini S&P 500 futures.
| Average Fill Price | Contract Quantity | Notional Value | Tick Value | |
|---|---|---|---|---|
| MNQ Sep23 | 15351 | 33 | $1,013,166.00 | $0.50 |
| MES Sep23 | 4492.5 | 45 | $1,010,812.50 | $1.25 |
Exit Price Scenario - 1
In this scenario, the Technology sector outperforms the broader market over the course of the trade. Specifically, the Nasdaq gains 5% and the S&P 500 gains 2%.
Calculated Spread Price - 3.518
| Average Fill Price | Contract Quantity | Change in Ticks | Profit/Loss (PnL) per leg | |
|---|---|---|---|---|
| MNQU3 | 16118.5 | 32 | 3070 | $49,120.00 |
| MESU3 | 4582.25 | 44 | 359 | -$19,745.00 |
| Overall PnL | $29,375.00 |
Exit Price Scenario - 2
In this scenario, the Technology sector declines relative to the broader market over the course of the trade. Both the Nasdaq and S&P 500 decline by 3%.
Calculated Spread Price - 3.417
| Average Fill Price | Contract Quantity | Change in Ticks | Profit/Loss (PnL) per leg | |
|---|---|---|---|---|
| MNQ Sep23 | 14890.5 | 32 | -1842 | -$29,472.00 |
| MES Sep23 | 4357.75 | 44 | -539 | $29,645.00 |
| Overall PnL | $173.00 |
Exit Price Scenario - 3
In this last scenario, the Technology sector underperformed the broader market over the course of the trade. Specifically the Nasdaq gains 3% and the S&P 500 gains 4%.
Calculated Spread Price - 3.384
| Average Fill Price | Contract Quantity | Change in Ticks | Profit/Loss (PnL) per leg | |
|---|---|---|---|---|
| MNQ Sep23 | 15811.5 | 32 | 1842 | $29,472.00 |
| MES Sep23 | 4672.25 | 44 | 719 | -$39,545.00 |
| Overall PnL | -$10,073.00 |
Margin Requirements
Maintenance Margin Requirement
| Per contract | Contract Quantity | Total | |
|---|---|---|---|
| MNQ Sep23 | $1,680.00 | 33 | $55,440.00 |
| MES Sep23 | $1,120.00 | 45 | $50,400.00 |
| Subtotal | $105,840.00 |
Margin Discount for Inter-Spread (MNQ vs MES)
CME allows a 70% discount on a 1 to 1 basis between the two contracts.
| Per contract | Contract Quantity | 70% Discount | |
|---|---|---|---|
| MNQ Sep23 | $1,680.00 | 33 | $16,632.00 |
| MES Sep23 | $1,120.00 | 33 | $11,088.00 |
| no discount | |||
| MES Sep23 | $1,120.00 | 12 | $13,440.00 |
| Maintenance Margin after discount | $41,160.00 |