Charts
Stochastic Momentum Index (STOCH)
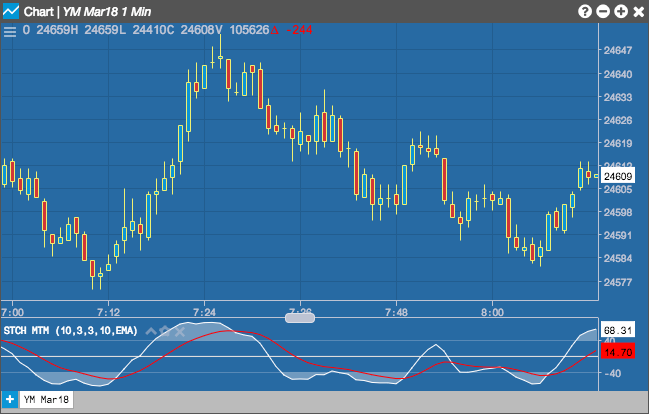
The Stochastic Momentum Index (Stoch) normalizes price as a percentage between 0 and 100. Normally two lines are plotted, the %K line and a moving average of the %K which is called %D. A slow stochastic can be created by initially smoothing the %K line with a moving average before it is displayed. The length of this smoothing is set in the Slow K Period. Without the initial smoothing ( i.e., setting the Slow K Period to a value of 1 ) the %K becomes the 'Raw %K' value, and is also known as a fast stochastic.
Configuration Options
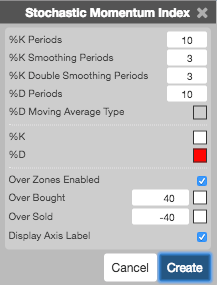
- %K Periods: TBD
- %K Smoothing Periods: TBD
- %K Double Smoothing Periods: TBD
- %D Periods: TBD
- %D Moving Average Type: TBD
- Color Selectors: Colors to use for graph elements.
- Over Zones Enabled: Whether to shade the area between the plot and the horizontal overbought and oversold levels.
- Over Bought: Overbought quantity
- Over Sold: Oversold quantity
- Display Axis Label: Whether to display the most recent value on the Y axis.
Formula
\[ Fast\; \%K = 100 * SMA \left (\frac{( Close - Low )}{(High - Low )},Time\ Period \right ) \]
\[ Slow\; \%K = SMA ( Fast\; \%K, Kma ) \]
\[ Slow\; \%D = SMA ( Slow\; \%K, Dma ) \]
where:
- Close = the current closing price
- Low = the lowest low in the past n periods
- High = the highest high in the past n periods
- Kma = Period of Moving Average used to smooth the Fast %K Values
- Dma = Period of Moving Average used to smooth the Slow %K Values