Charts
STARC Bands
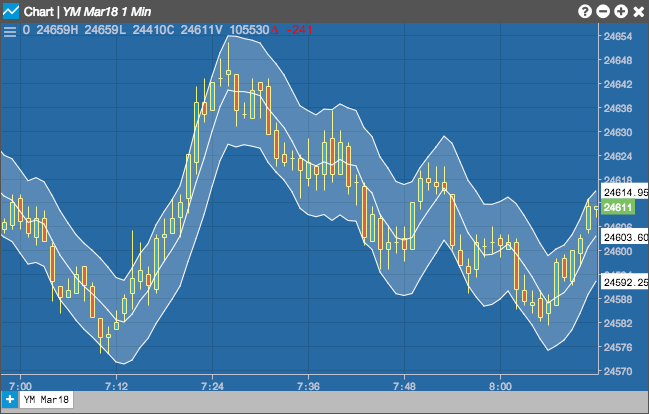
The STARC (Stoller Average Range Channels) Bands indicator calculates upper and lower bands around a simple moving average to predict price movement. A price move toward the upper band may mean a pull back towards the moving average, and a move to the lower band may mean a move up towards the moving average.
Configuration Options
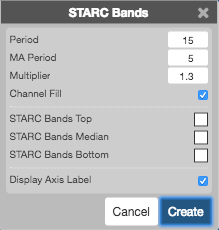
- Period: Number of bars to use in the calculations.
- MA Period: Number of periods to use for calculating the moving average.
- Multiplier: Moving average multipler to define the distance to draw the bands away from the ATR.
- Channel Fill: Whether to shade the region between the upper and lower bands.
- Color Selectors: Colors to use for graph elements.
- Display Axis Label: Whether to display the most recent value on the Y axis.
Formula
\[ Upper\;STARC\;band = SMA + (ATR * multiplier) \]
\[ Lower\;STARC\;band = SMA - (ATR * multiplier) \]