Charts
Relative Volatility
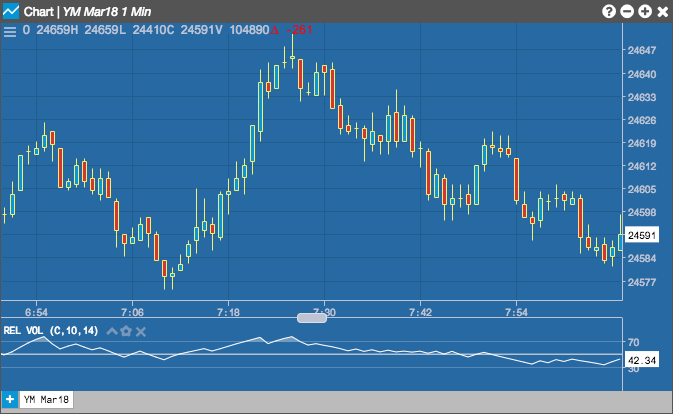
The Relative Volatility indicator measures the standard deviation of price changes within a defined range of lookback periods to determine market direction. The indicator value is normalized as a percentage between 0 and 100.
Configuration Options
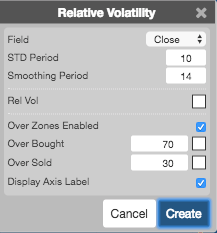
- Field: Price or combination of prices to use as the base for average calculations. Possible values include:
- Open
- High
- Low
- Close
- Adjusted Close
- HL/2 \( \left ( \frac{High + Low}{2} \right ) \)
- HLC/3 \( \left ( \frac{High + Low + Close}{3} \right ) \)
- HLCC/4 \( \left ( \frac{High + Low + Close + Close}{4} \right ) \)
- OHLC/4 \( \left ( \frac{Open + High + Low + Close}{4} \right ) \)
- STD Period: Number of standard deviation periods to use in the calculation.
- Smoothing Period: Number of smoothing periods to use in the calculation.
- Color Selectors: Colors to use for graph elements.
- Over Zones Enabled: Whether to shade the area between the plot and the horizontal overbought and oversold levels.
- Over Bought: Overbought quantity
- Over Sold: Oversold quantity
- Over Bought:
- Over Sold:
- Display Axis Label: Whether to display the most recent value on the Y axis.
Formula
\[ RVI = 100 \times \frac{Usum}{(Usum + Dsum)} \]
where:
- Usum is the averaged sum of STD for positive days
- Dsum is the averaged sum of STD for negative days