Charts
Relative Vigor Index
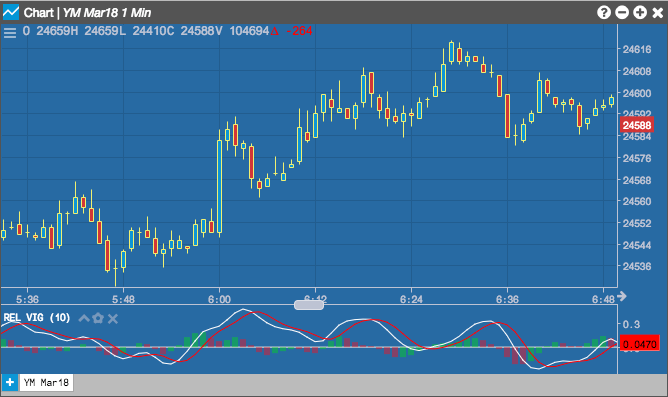
The Relative Vigor Index (RVI) is an oscillator that compares an instrument's Close price and Open price to measure the strength of price movements and determine a trend in market activity.
Configuration Options
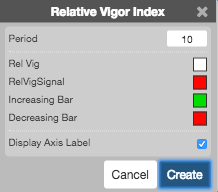
- Period: Number of bars to use in the calculations.
- Color Selectors: Colors to use for graph elements.
- Display Axis Label: Whether to display the most recent value on the Y axis.
Formula
Usually RVI is displayed as two lines:
\[ RVI_{1} = \frac{(Close - Open)}{(High - Low)} \]
\[ RVI_{n{\text -}period} = n{\text -}period\; SMA\; of\; RVI_{1} \]