Charts
Random Walk Index
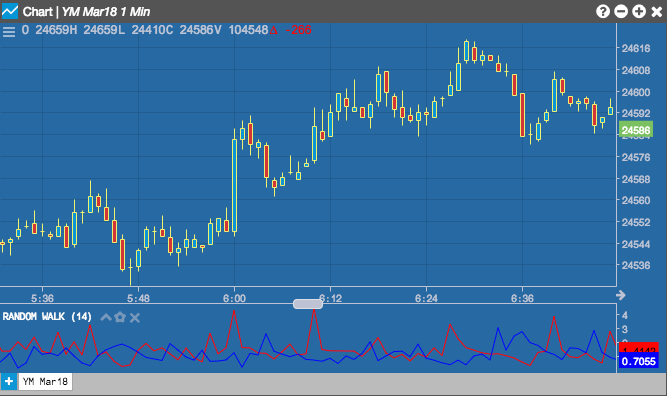
The Random Walk Index indicator determines if price movement is random or the result of a statistically significant trend over a specific time period.
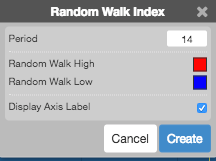
Configuration Options
- Field: Price or combination of prices to use as the base for average calculations. Possible values include:
- Open
- High
- Low
- Close
- Adjusted Close
- HL/2 \( \left ( \frac{High + Low}{2} \right ) \)
- HLC/3 \( \left ( \frac{High + Low + Close}{3} \right ) \)
- HLCC/4 \( \left ( \frac{High + Low + Close + Close}{4} \right ) \)
- OHLC/4 \( \left ( \frac{Open + High + Low + Close}{4} \right ) \)
- Color Selectors: Colors to use for graph elements.
- Display Axis Label: Whether to display the most recent value on the Y axis.
Formula
\[ RW_{low} = \frac{High_{1-n} - Low}{ATR_{n} * \sqrt n} \]
\[ RW_{high} = \frac{High - Low_{1-n}}{ATR_{n} * \sqrt n} \]
where ATR is the average true range over N periods preceding the current period.