Charts
Rainbow Oscillator
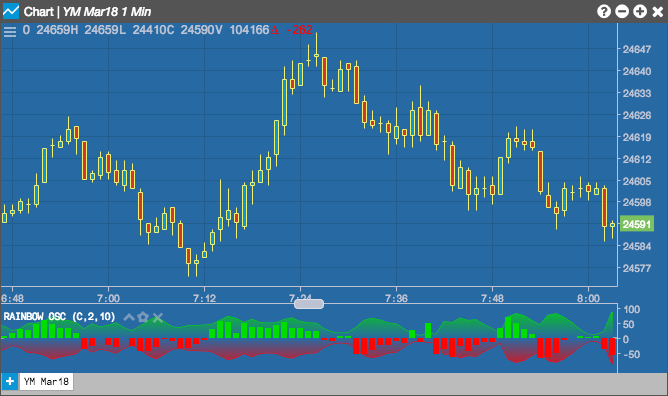
The Rainbow Oscillator calculates and displays the highest high and the lowest low of one or more simple moving averages to determine market trends. The oscillator curves are created based the moving average calculations. The high and low oscillator curves are color-coded in the chart, and market trends can be determined based on the width of the curves.
Configuration Options
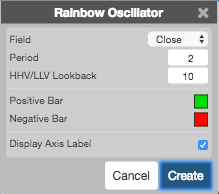
- Field: Price or combination of prices to use as the base for average calculations. Possible values include:
- Open
- High
- Low
- Close
- Adjusted Close
- HL/2 \( \left ( \frac{High + Low}{2} \right ) \)
- HLC/3 \( \left ( \frac{High + Low + Close}{3} \right ) \)
- HLCC/4 \( \left ( \frac{High + Low + Close + Close}{4} \right ) \)
- OHLC/4 \( \left ( \frac{Open + High + Low + Close}{4} \right ) \)
- Period: Number of bars to use in the calculations.
- HHV/LLV Lookback: Sets how many highest high value (HHV)/lowest low value (LLV) preceding periods to include in the oscillator.
- Color Selectors: Colors to use for graph elements.
- Display Axis Label: Whether to display the most recent value on the Y axis.