Charts
Volume Delta
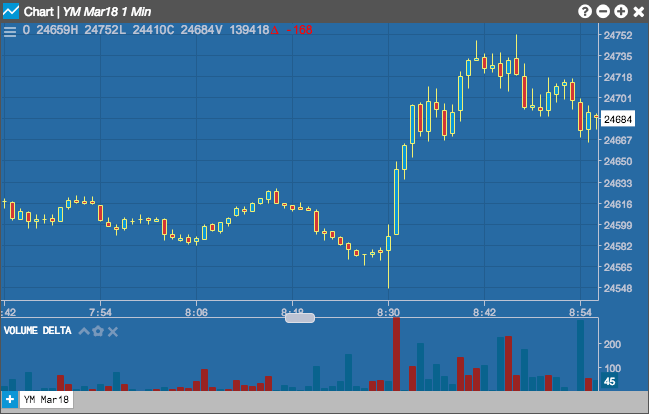
The Volume Delta indicator displays the total amount of transactions occurring on both the Bid and the Ask in a given interval (similar to CBAVol), but also superimposes the absolute value of the net difference between the BVol and AVol for that interval. Whichever is greater (BVol or AVol) is displayed in that color on top of the total volume.

Configuration Options

- Color Selectors: Colors to use for graph elements.
- Display Axis Label: Whether to display the most recent value on the Y axis.
Formula
Bid/Ask Volume Tick = Number of transactions at the Bid and the Ask
Bid/Ask Volume Actual = Number of contracts traded at the Bid and the Ask
Additional display line = | BVol - AVol |, color represents whichever is greater (BVol or AVol)