Charts
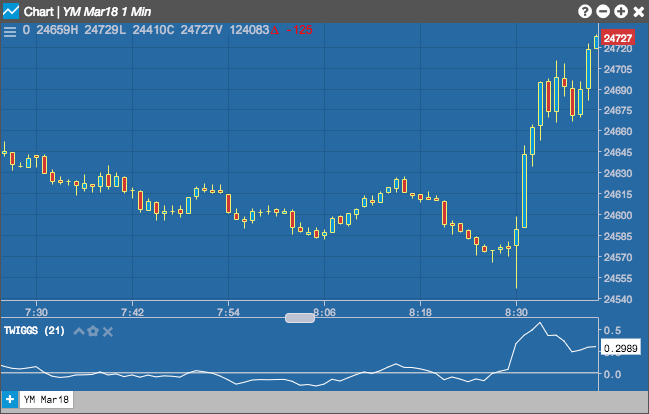
Twiggs Money Flow
Colin Twiggs' Money Flow indicator is similar to the Chaikin Money Flow (CMF). Where Chaikin Money Flow uses CLV (Close Location Value) to to evaluate volume (money flow) as bullish or as bearish, Twigs Money Flow, uses the TR (True Range). Twiggs Money Flow also relies on moving averages in its calculation while Chaikin uses cumulative volume.
Configuration Options
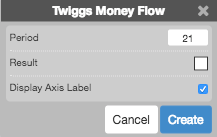
- Period: Number of bars to use in the calculations.
- Color Selectors: Colors to use for graph elements.
- Display Axis Label: Whether to display the most recent value on the Y axis.
Formula
The Twiggs Money Flow indicator uses the following values for the calculation:
- Exponential Moving Average (EMA): a weighted moving average that applies more value to the most recent data.
- Lowest Low (LL): the lowest value of either the current low price or the previous day's close.
- Highest High (HH): the highest value of either the current high price or the previous day's close.
\[ TMF = \frac{EMA \left [Volume * \left ( \frac{(Close - LL)} {(HH - LL)} * 2 - 1 \right) \right ]}{EMA[Volume]} \times 100 \]