Charts
TRIX
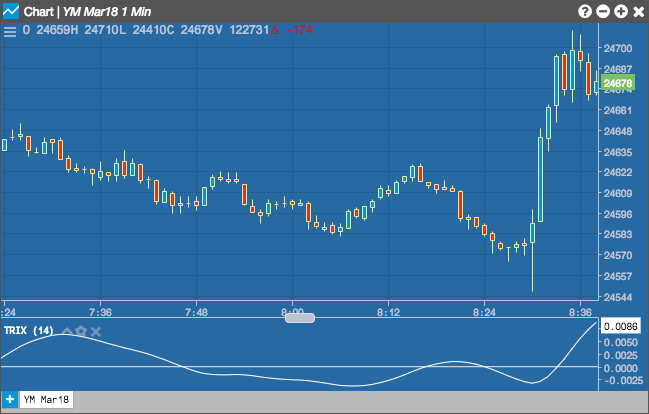
The Triple Exponential Moving Average Oscillator (TRIX) by Jack Hutson is a momentum indicator that oscillates around zero. It displays the percentage rate of change between two triple smoothed exponential moving averages.
Configuration Options
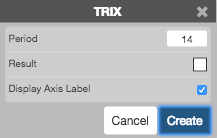
- Period: Number of bars to use in the calculations.
- Color Selectors: Colors to use for graph elements.
- Display Axis Label: Whether to display the most recent value on the Y axis.
Formula
\[EMA1 = EMA1_\text{n-1} + \left ( \left (\frac{2}{(n + 1)} \right) * (P_n - EMA1_\text{n-1}) \right)\]
\(EMA2 = EMA2n-1 + ((2 / (n + 1)) * (EMA1n - EMA2n-1)))\
\[EMA2 = EMA2_\text{n-1} + \left ( \left (\frac{2}{(n + 1)} \right) * (EMA1_n - EMA2_\text{n-1}) \right)\]
\(EMA3 = EMA3n-1 + ((2 / (n + 1)) * (EMA2n - EMA3n-1)))\
\[EMA3 = EMA3_\text{n-1} + \left ( \left (\frac{2}{(n + 1)} \right) * (EMA2_n - EMA3_\text{n-1}) \right)\]
TRIX = (EMA3n - EMA3n-1 ) / EMA3n-1)\
\[ TRIX = \frac{(EMA3_n - EMA3_\text{n-1})}{EMA3_\text{n-1}} \]
where:
- Pn = the current price.
- EMA1n-1 = the exponential moving average value of n periods back
- EMA2n-1 = the exponential moving average value of n periods back
- EMA3n-1 = the exponential moving average value of n periods back