Charts
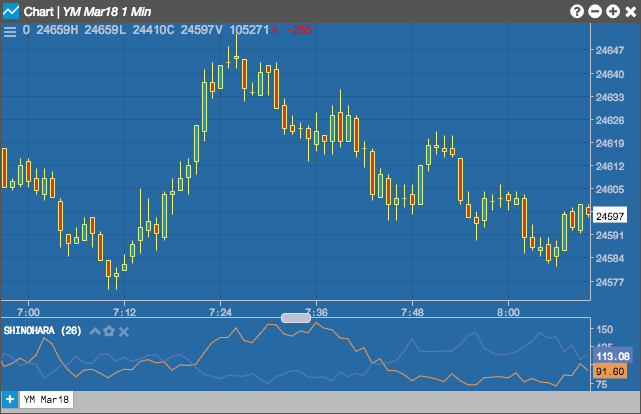
Shinohara Intensity Ratio
The Shinohara Intensity Ratio indicator...
Configuration Options
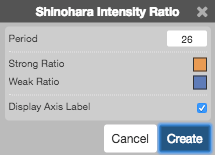
- Period: Number of bars to use in the calculations.
- Color Selectors: Colors to use for graph elements.
- Display Axis Label: Whether to display the most recent value on the Y axis.