Charts
Pring's Special K
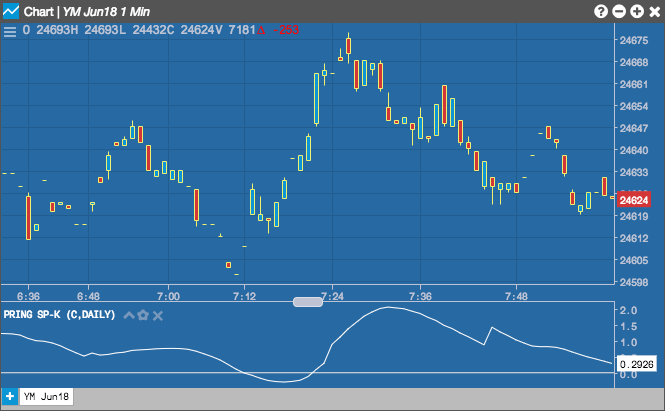
The Pring's Special K indicator combines short-term, intermediate and long-term velocity into one complete series, thereby giving us true summed cyclicality. It has two functions: to identify primary trend reversals at a relatively early stage and to use that information for timing short-term pro-trend price moves.

Configuration Options

- Field: Price or combination of prices to use as the base for average calculations. Possible values include:
- Open
- High
- Low
- Close
- Adjusted Close
- HL/2 \( \left ( \frac{High + Low}{2} \right ) \)
- HLC/3 \( \left ( \frac{High + Low + Close}{3} \right ) \)
- HLCC/4 \( \left ( \frac{High + Low + Close + Close}{4} \right ) \)
- OHLC/4 \( \left ( \frac{Open + High + Low + Close}{4} \right ) \)
-
Interval:
- Daily
- Weekly
- Color Selectors: Colors to use for graph elements.
- Display Axis Label: Whether to display the most recent value on the Y axis.