Charts
Price Momentum Oscillator
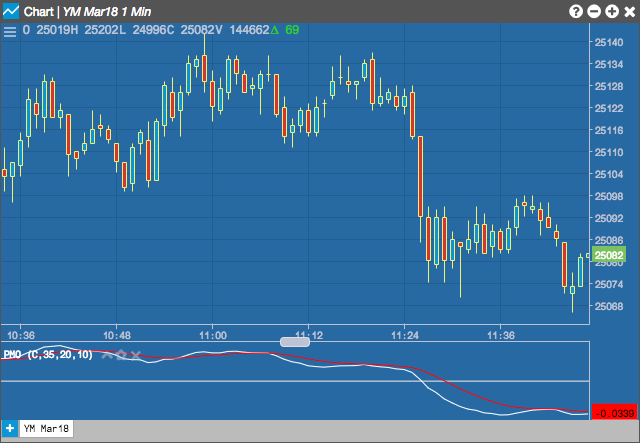
The Price Momentum Oscillator (PMO) indicator compares the current price with the previous price from a selected number of periods ago. This indicator is similar to the “Rate of Change” indicator, but the MOM does not normalize the price, so different instruments can have different indicator values based on their point values.
Configuration Options
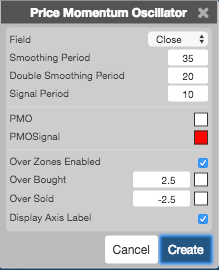
- Field: Price or combination of prices to use as the base for average calculations. Possible values include:
- Open
- High
- Low
- Close
- Adjusted Close
- HL/2 \( \left ( \frac{High + Low}{2} \right ) \)
- HLC/3 \( \left ( \frac{High + Low + Close}{3} \right ) \)
- HLCC/4 \( \left ( \frac{High + Low + Close + Close}{4} \right ) \)
- OHLC/4 \( \left ( \frac{Open + High + Low + Close}{4} \right ) \)
- Smoothing Period: TBD
- Double Smoothing Period: TBD
- Signal Period: TBD
- Color Selectors: Colors to use for graph elements.
- Over Zones Enabled: Whether to shade the area between the plot and the horizontal overbought and oversold levels.
- Over Bought: Overbought quantity
- Over Sold: Oversold quantity
- Display Axis Label: Whether to display the most recent value on the Y axis.