Charts
Positive Volume Index (PVI)
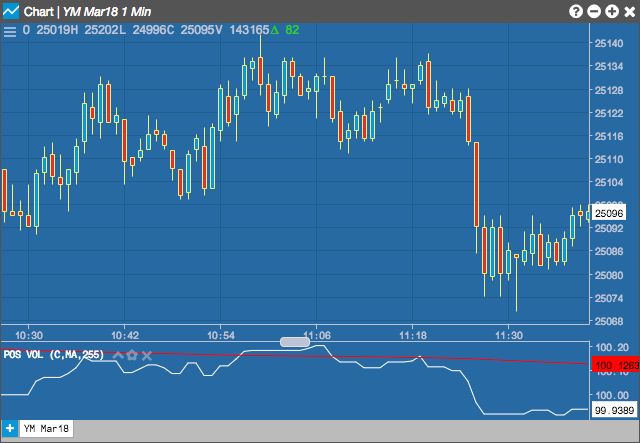
The Positive Volume Index (PVI), as well as the Negative Volume Index (VMI), indicator tracks the changes in the number of transactions, or trading volume, of an instrument. Price changes on decreasing trading volume are considered to be a positive indicator, while price changes during periods of increased trading volume are considered to be a negative indicator. The idea behid the indicator is that well-informed traders ("smart money") are involved when trading volumes decrease, while increasing trading volumes can indicate a follow-the-crowd mentality ("not-so-smart money").
The PVI displays what the "not-so-smart money" is doing; while the NVI tracks what the "smart money" is doing.
Configuration Options
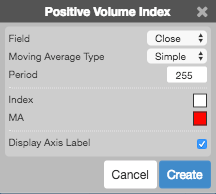
- Field: Price or combination of prices to use as the base for average calculations. Possible values include:
- Open
- High
- Low
- Close
- Adjusted Close
- HL/2 \( \left ( \frac{High + Low}{2} \right ) \)
- HLC/3 \( \left ( \frac{High + Low + Close}{3} \right ) \)
- HLCC/4 \( \left ( \frac{High + Low + Close + Close}{4} \right ) \)
- OHLC/4 \( \left ( \frac{Open + High + Low + Close}{4} \right ) \)
- Moving Average Type: Type of moving average to use in the calculations:
- Simple: Mean (average) of the data.
- Exponential: Newer data are weighted more heavily geometrically.
- Time Series: Calculates a linear regression trendline using the “least squares fit” method.
- Triangular: Weighted average where the middle data are given the most weight, decreasing linearly to the end points.
- Variable: An exponential moving average with a volatility index factored into the smoothing formula. The Variable Moving average uses the Chande Momentum Oscillator as the volatility index.
- VIDYA: An exponential moving average with a volatility index factored into the smoothing formula. The VIDYA moving average uses the Standard Deviation as the volatility index. (Volatility Index DYnamic Average).
- Weighted: Newer data are weighted more heavily arithmetically.
- Welles Winder:The standard exponential moving average formula converts the time period to a fraction using the formula EMA% = 2/(n + 1) where n is the number of days. For example, the EMA% for 14 days is 2/(14 days +1) = 13.3%. Wilder, however, uses an EMA% of 1/14 (1/n) which equals 7.1%. This equates to a 27-day exponential moving average using the standard formula.
- Hull: The Hull Moving Average makes a moving average more responsive while maintaining a curve smoothness. The formula for calculating this average is as follows: HMA[i] = MA( (2*MA(input, period/2) – MA(input, period)), SQRT(period)) where MA is a moving average and SQRT is square root.
- Double Exponential: The Double Exponential moving average attempts to remove the inherent lag associated to Moving Averages by placing more weight on recent values.
- Triple Exponential: TBD
- Simple
- Exponential
- Time Series
- Triangular
- Variable
- VIDYA
- Weighted
- Welles Winder
- Hull
- Double Exponential
- Triple Exponential
- Period: Number of bars to use in the calculations.
- Color Selectors: Colors to use for graph elements.
- Display Axis Label: Whether to display the most recent value on the Y axis.
Formula
Positive volume index is calculated as follows:
- If today's volume is greater than yesterday's volume: \[ PVI = PVI_\text{yesterday} + \left( \frac {FieldPrice - FieldPrice_\text{yesterday}}{FieldPrice_\text{yesterday}} \times PVI_\text{yesterday} \right )\]
- Otherwise: \[ PVI = PVI_\text{yesterday} \]