Charts
Momentum Indicator
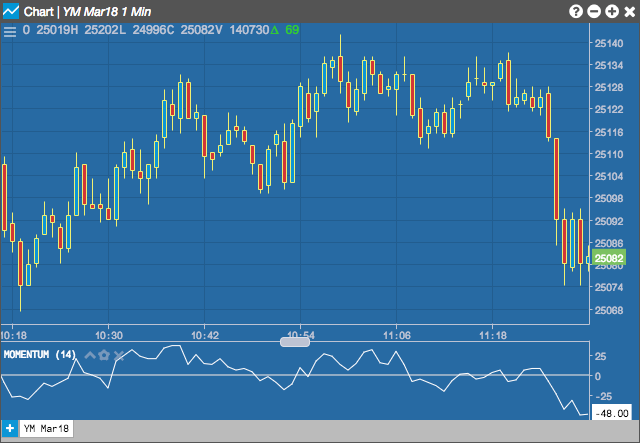
The Momentum Indicator identifies when the price is moving upwards or downwards, and by how much.. The Momentum indicator compares the most recent closing price to a previous closing price of any time frame. The Momentum indicator is regarded as an excellent gauge of market strength. A shorter period setting will create a more sensitive indicator, but will also increase choppiness and the potential for increased false signals.
Configuration Options
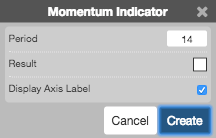
- Period: Number of bars to use in the calculations.
- Color Selectors: Colors to use for graph elements.
- Display Axis Label: Whether to display the most recent value on the Y axis.
Formula
\[MI = Current\;Price – Price_{n-periods\;ago} \]