Charts
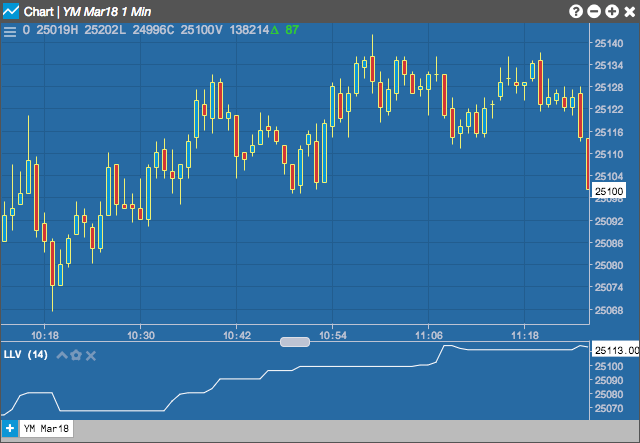
Lowest Low Value (LL)
The Lowest Low Value indicator simply returns the lowest low price over a user defined n-periods.
Configuration Options
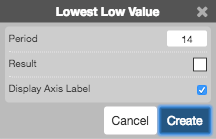
- Period: Number of bars to use in the calculations.
- Color Selectors: Colors to use for graph elements.
- Display Axis Label: Whether to display the most recent value on the Y axis.
Formula
\[LL = Min(Low)_{n-periods}\]