Charts
Coppock Curve (CC)
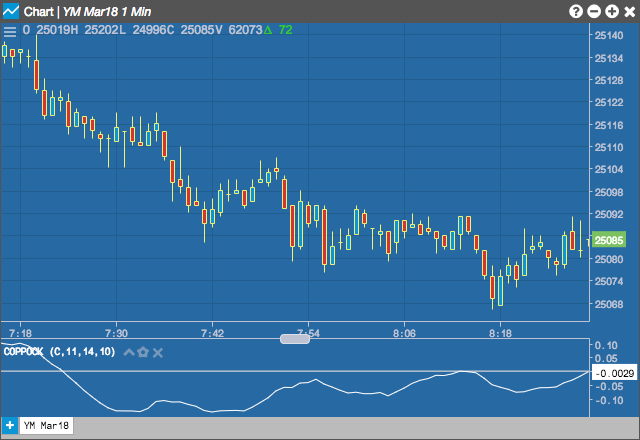
The Coppock Curve indicator tries to identify buy signals in a market by looking at market activity on a monthly time scale. It adds the rates of change for a short and a long period of months and then smooths by another period's weighted moving average. Typically, a potential buy signal occurs when the indicator is below 0 and then rises above it.
Configuration Options
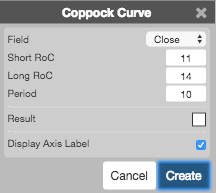
- Field: Price or combination of prices to use as the base for average calculations. Possible values include:
- Open
- High
- Low
- Close
- Adjusted Close
- HL/2 \( \left ( \frac{High + Low}{2} \right ) \)
- HLC/3 \( \left ( \frac{High + Low + Close}{3} \right ) \)
- HLCC/4 \( \left ( \frac{High + Low + Close + Close}{4} \right ) \)
- OHLC/4 \( \left ( \frac{Open + High + Low + Close}{4} \right ) \)
- Short RoC: Number of periods in the short rate-of-change indicator.
- Long RoC: Number of periods in the long rate-of-change indicator.
- Period: Number of bars to use in the calculations.
- Color Selectors: Colors to use for graph elements.
- Display Axis Label: Whether to display the most recent value on the Y axis.
Formula
\[Coppock = WMA_\text{period}\;of\;(ROC_\text{Long RoC periods}+ROC_\text{Short RoC periods})\]
where:
- WMA is the weighted moving average.
- ROC is the rate of change indicator.