Charts
Choppiness Index
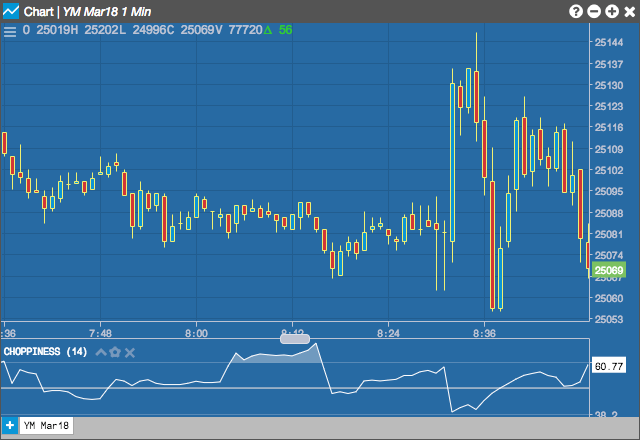
The Choppiness Index indicator helps determine whether the market is choppy (trading sideways) or not choppy (trading within a trend in either direction). It shows how long an individual segment of the market outperforms the market in general.
Configuration Options
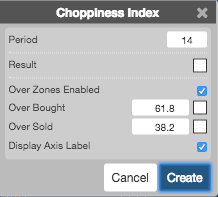
- Period: Number of bars to use in the calculations.
- Color Selectors: Colors to use for graph elements.
- Over Zones Enabled: Whether to shade the area between the plot and the horizontal overbought and oversold levels.
- Over Bought: Overbought quantity
- Over Sold: Oversold quantity
- Display Axis Label: Whether to display the most recent value on the Y axis.
Formula
CI = 100 * LOG10( SUM(ATR(1), n) / ( MaxHi(n) - MinLo(n) ) ) / LOG10(n)
\[ CI = \frac{\frac{(100 * LOG10(\sum_1^n ATR)}{(MaxHigh(n) - MinLow(n))}}{LOG10(n)} \]
where:
- n = User defined period length.
- LOG10(n) = base-10 LOG of n
- ATR(1) = Average True Range (Period of 1)
- SUM(ATR(1), n) = Sum of the Average True Range over past n bars
- MaxHigh(n) = The highest high over past n bars
- MinLow(n) = The lowest low over past n bars