Charts
Center of Gravity (COG)
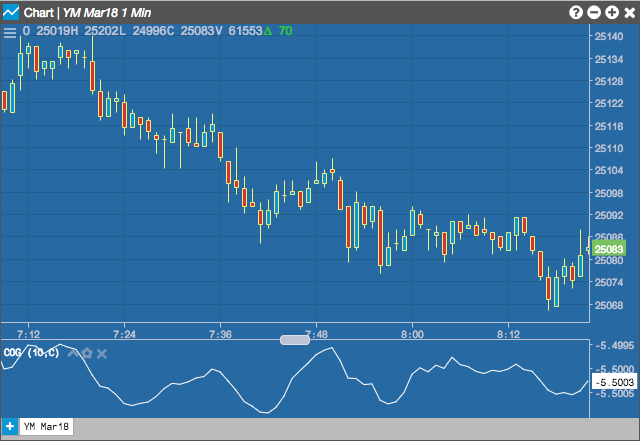
The Center of Gravity oscillator, developed by John Ehler, produces less lag indicating pivot points. The indicator was the result of studies of adaptive filters.
Configuration Options
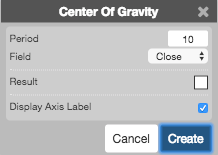
- Period: Number of days in the to use for calculations.
- Field: Price or combination of prices to use as the base for average calculations. Possible values include:
- Open
- High
- Low
- Close
- Adjusted Close
- HL/2 \( \left ( \frac{High + Low}{2} \right ) \)
- HLC/3 \( \left ( \frac{High + Low + Close}{3} \right ) \)
- HLCC/4 \( \left ( \frac{High + Low + Close + Close}{4} \right ) \)
- OHLC/4 \( \left ( \frac{Open + High + Low + Close}{4} \right ) \)
- Color Selectors: Colors to use for graph elements.
- Display Axis Label: Whether to display the most recent value on the Y axis.
Formula
\[COG = \frac{-\sum P_{n}\times \left ( n+1 \right )}{\sum P_{n}}\]