Charts
Awesome Oscillator
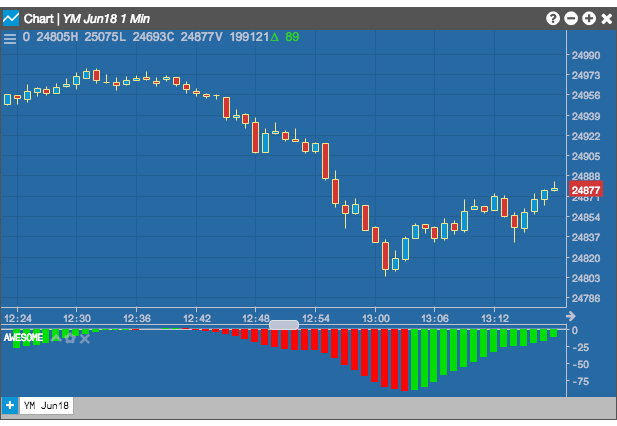
The Awesome Oscillator indicator is designed to measure changes in momentum by comparing two simple moving averages. It subtracts the simple moving average of the price bar's midpoint for the previous 34 bars from the previous 5 bars simple moving average. The indicator displays a histogram of green and red bars. A red bar indicates the current bar is lower than the previous, while a green bar indicates the current bar is higher than the previous bar. The shape and color of the histogram can help identify trends.

Configuration Options

- Color Selectors: Colors to use for graph elements.
- Display Axis Label: Whether to display the most recent value on the Y axis.
Formula
\[ AO = SMA_{5-periods}(\frac {(High + Low)}{2}) - SMA_{34-periods}(\frac {(High + Low)}{2}) \]