Monitor
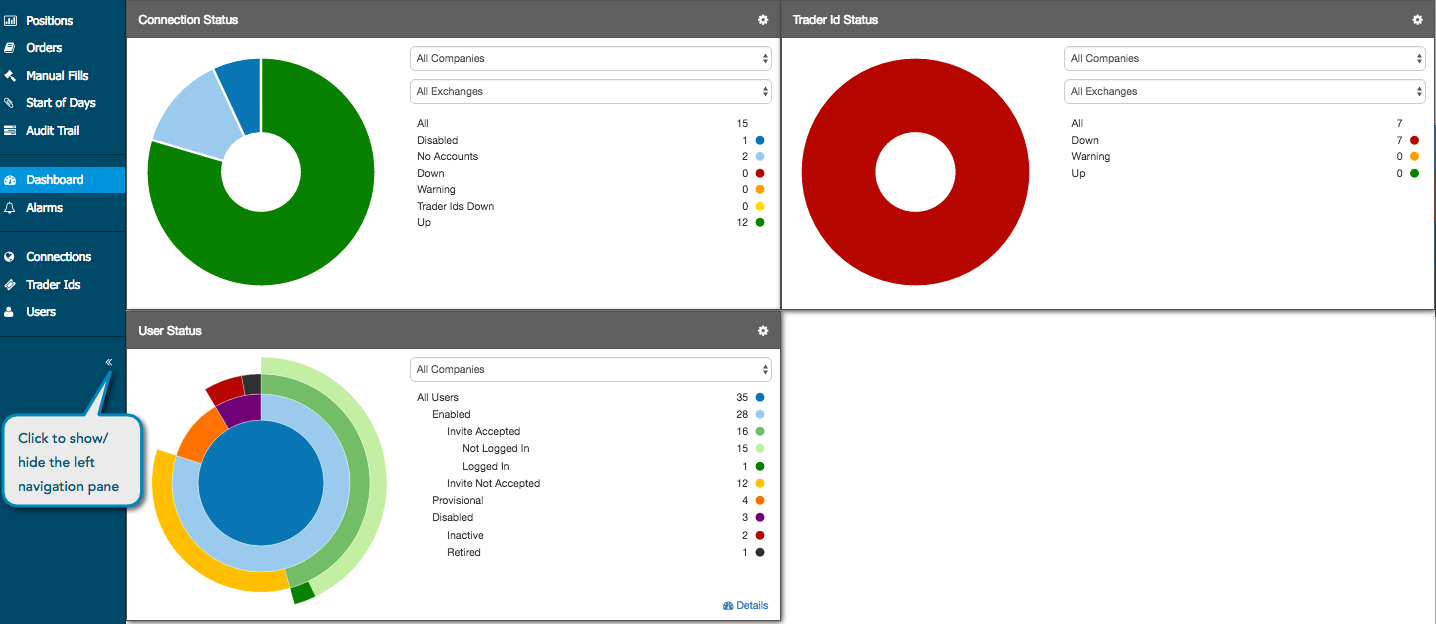
Monitor Dashboard
The Monitor dashboard provides an overview of user, connection, and trader ID status in your company. Company administrators and individual users can both view connection and trader ID status for their company, as well as any other companies that your firm shares users or accounts with via the Setup app. Company administrators can also view the status of all users that are members of their firm or shared with their firm from different companies, but individual users will only see their own user status on the dashboard.
Connection status
Use the Connection Status section of the dashboard to view connections in your company, as well as connections that are managed by other companies but assigned to accounts shared with your company.
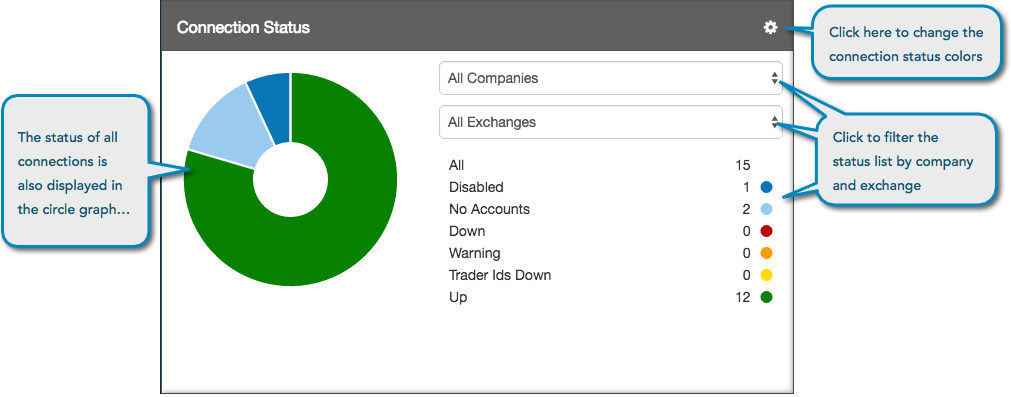
Click on a status in the list or click the circle graph to open the Connections screen for a list of all connections. If you click a status in the list, the circle graph on the Connections screen will display the selected status in relation to the other statuses in the graph.
Each status is color-coded in the dashboard. You can change the colors assigned to a connection status by clicking the gear icon to display the Connection Status Settings.
User status
Use the User Status section of the dashboard to view users in your company, as well as users that are members by other companies but shared with your company.
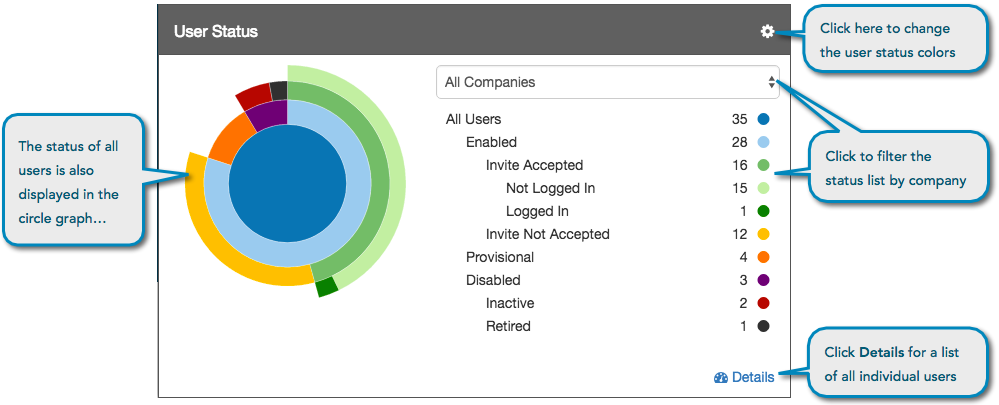
Click on Details in the bottom right corner of the section or click the circle graph to open the Users screen for a list of all users. If you click a status in the list, it will open the Users screen and the circle graph will display the selected status at the center of the graph.
Each status is color-coded in the dashboard. You can change the colors assigned to a user status by clicking the gear icon to display the User Status Settings.
Trader Id status
Use the Trader Id Status section of the dashboard to view trader identification (ID) credentials assigned to connections in your company, as well as to connections that are managed by other companies but assigned to accounts shared with your company.
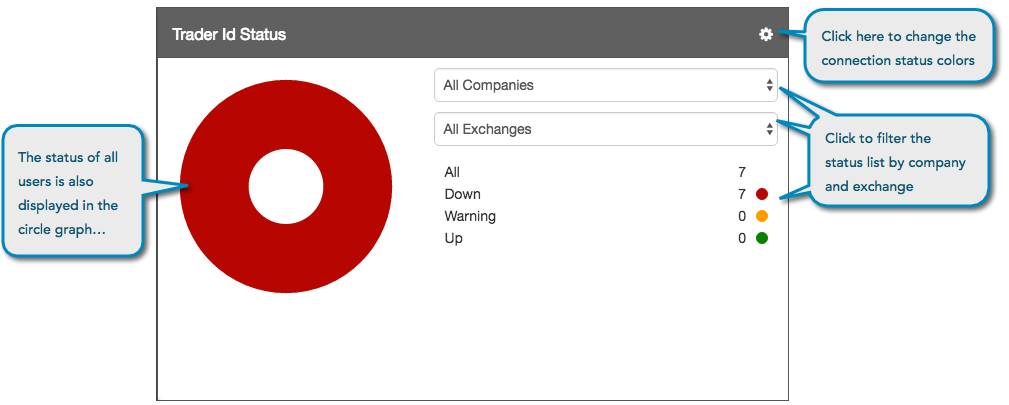
Click on a status in the list or click the circle graph to open the Trader Ids screen for a list of all trader IDs. If you click a status in the list, the circle graph on the Trader Ids screen will display the selected status at the center of the graph.
Each status is color-coded in the dashboard. You can change the colors assigned to a trader ID status by clicking the gear icon to display the Trader Id Status Settings.
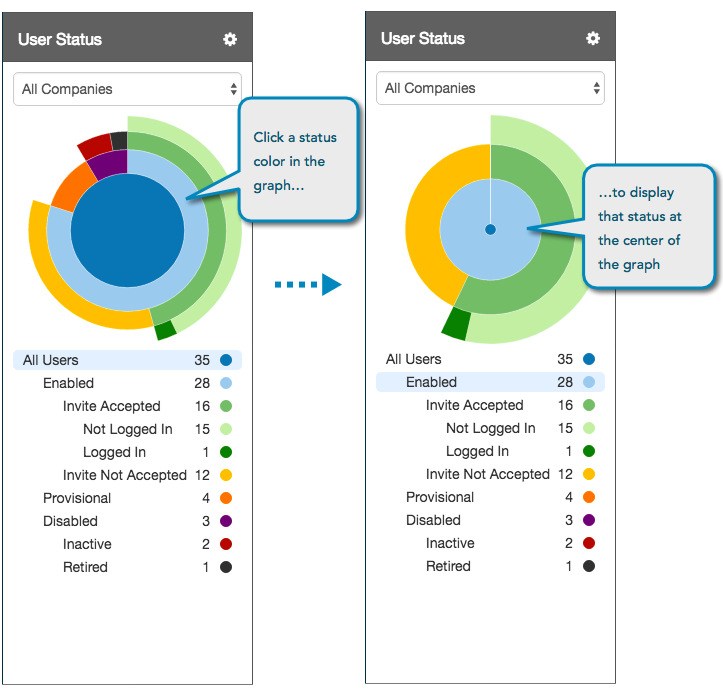
Displaying status in the circle graph
In each section of the dashboard and related tabs in the left navigation, you can click a status in the list or color in the circle graph to view the selected status in relation to the others. For example, if you click the color in the graph for the Enabled Users status in the User Status section, the graph repaints and displays all statuses in relation to enabled users. All users are represented at the center of the graph.