TT Mobile on Android
Charts
Accessing analytical charts
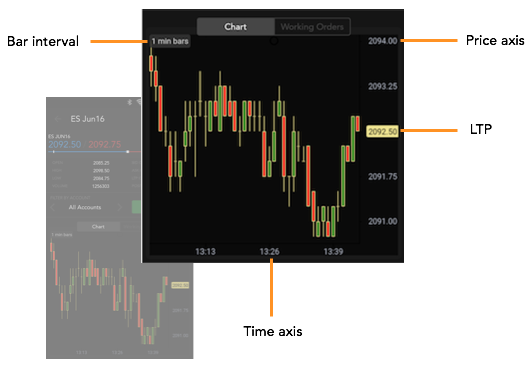
The Chart pane allows you to access a wealth of historical and analytical data for the instrument. By default, it shows a one-minute bar chart for the instrument. You can pinch-and-zoom the chart to increase or decrease the time and price display ranges.
Customizing the chart
To customize the chart, tap anywhere in the chart to display the chart options.
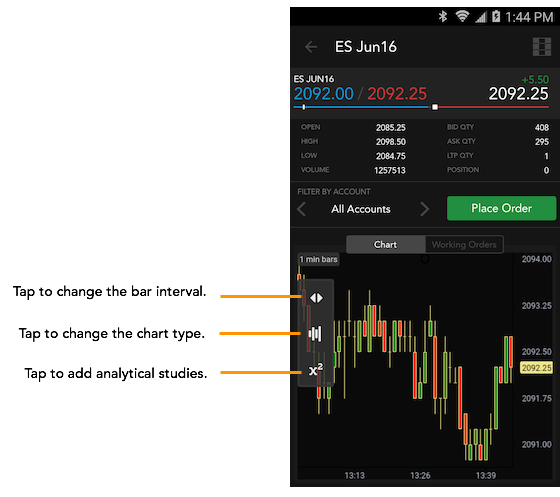
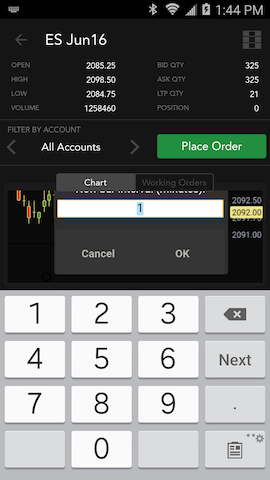
To change the duration of the bar interval, tap the interval icon (top icon) and enter a new value. The chart updates using the new interval.
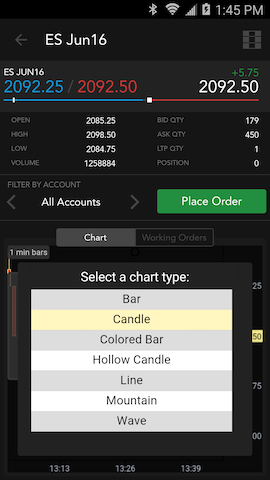
If you prefer other types of charts, you can tap the Chart Type icon (middle) and select another type.
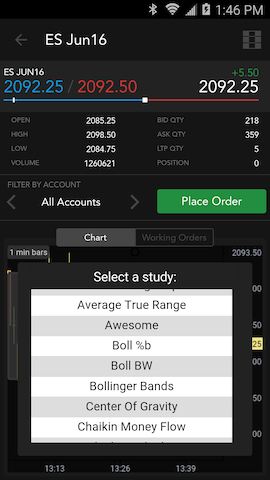
Finally, Chart offers many different analytical studies you can overlay on the chart to provide additional insight into the market data. To select a study, tap the Study icon (bottom) to display the available studies. Scroll through the list until you find the study you want. You can add multiple studies to the chart, if desired.
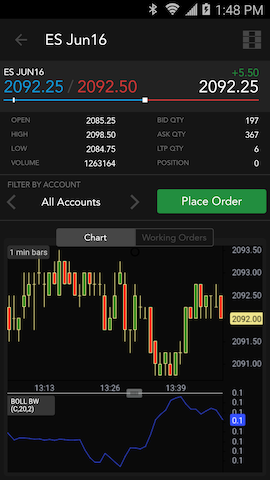
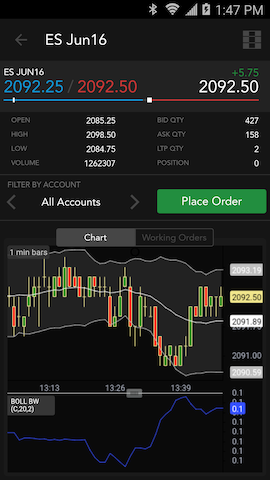
In this case, you choose the Bollinger Bands and Boll BW studies. After entering the parameters required for the selected studies, the studies are displayed on the chart.
To remove a study from the chart, tap the Remove (minus icon) and select the study.
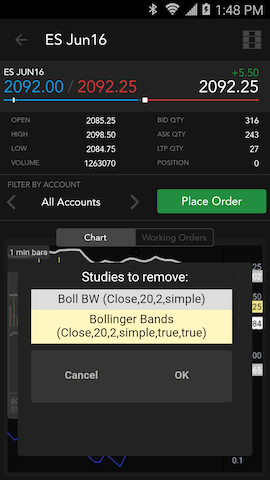
The chart updates. In this case, you removed the Bollinger Bands study so only the Boll BW study is shown on the chart.