Market Abuse Models
Price Ramping
Price ramping is an attempt to create directional price movement. The Price Ramping model can detect a series of aggressive orders submitted in a short time span that trade through multiple price levels on the same side of the market.
Price Ramping scoring methodology
To detect potential price ramping, TT Trade Surveillance searches for specific patterns of fill activity by the same trader who submitted the aggressive orders. It looks for traders who place multiple orders that immediately lift offers or hit bids within a short time frame (aggressive orders). For each of these aggressive orders, TT Trade Surveillance identifies fill prices for orders executed at multiple price levels and whether the changing fill prices trend in same side as the aggressive orders.
The Price Ramping score is based on a sliding scale between 0-100. For example, a cluster score of "75" indicates that many aggressive orders were filled at multiple price levels.
Price Ramping scorecard metrics
The Scorecard Metrics section measures the following statistics related to price ramping:
- Ramping Price Levels: Number of price levels at which the aggressive orders were filled. The sequence of price levels at which fills occur corresponds to the movement in market price (e.g., Sell orders at decreasing price levels that contribute to a decrease in market price).
- Ramping Side: Indicates which side of the trade the ramping occurred (Buy or Sell).
- Aggressor Fill Qty: The quantity of aggressive order fills. Note: Applies to exchanges that have an aggressor fill tag.
- Fill Qty: Ramping fill quantity.
- Aggressor Fill Percentage: The percentage of trader volume that filled aggressively. Note: Applies to exchanges that have an aggressor fill tag.
- Buy Fill Ratio: The ratio of Buy fills to total fills.
- Buy Fill Ratio: The ratio of Sell fills to total fills.
- VWAP Buy: The average traded price of an instrument based on Buy volume and price.
- VWAP Sell: The average traded price of an instrument based on Sell volume and price.
- Ramping Prices: The list of fill prices in ascending or descending order.
Identifying Price Ramping
If the Price Ramping model displays multiple price levels for a cluster, this may indicate that the trader is attempting to ignite a price movement in a particular direction (Buy or Sell) to mislead other market participants or create an artificial price.
When investigating Price Ramping clusters with TT Trade Surveillance, consider the following:
- The number of price levels with aggressive orders.
- The side and fill quantity of each aggressive order.
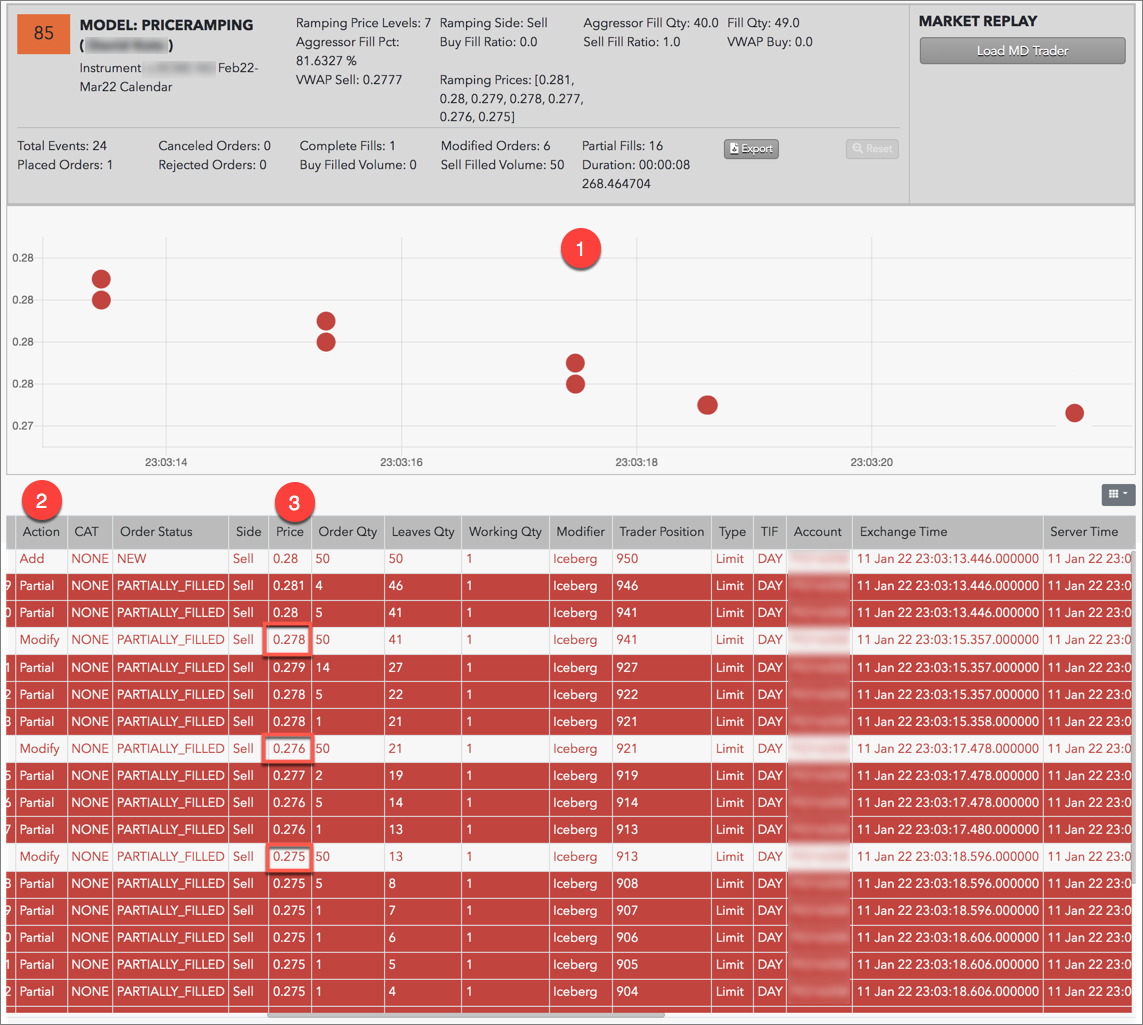
Using the Cluster Scorecard, you can analyze the activity that triggered the high cluster score. The pressure chart on the scorecard provides visual clues about the potential suspect trading pattern. The audit trail data on the scorecard can be used to verify order information and timing of the activity. The following example shows trading activity identified as potential price ramping.

In this example:
- The pressure chart shows multiple price levels ramping down on the Sell side.
- The "Action" column in the audit trail shows that multiple aggressive Sell orders were partially filled in a short time span.
- The "Price" column shows the aggressive Sell orders were placed below the market as the price was moving lower (e.g., .278, .276, .275).