Market Abuse Models
Floor/Ceiling
Floor/Ceiling model detects a pattern of trading activity intended to maintain the price of an instrument during the trading session. The pattern reflects an attempt to prevent the instrument price from trading lower (creating a price 'floor') or higher (creating a price 'ceiling').
To keep a price from moving through a particular price level, a trader can place one order or multiple orders on one side (buy/sell) of the market at a specific price level. These orders include a significant amount of the trading volume relative to the normal amount for the instrument. This reduces the likelihood that the market will move though that price.
This approach may not result in profit within the particular instrument, however, it may be related to another position that is tied to the price of this instrument.
Scoring methodology
To detect a trader's potential for creating a price floor or a price ceiling, TT Trade Surveillance analyzes the following data during the trading period:
- The low and high prices for the instrument during the trading session
- Total market volume and percent of session volume traded at the high or low price
- Trader's volume at the high or low price level
- Traders percentage of volume at the high or low price level
- Trader's percentage of market volume at the high or low price level
- Trader's percentage of passive trading at the high or low level
Score interpretation
The score assigned to a cluster is based on a sliding scale between 0-100 using a weighted calculation. A score of 75 and above is a good indication that the suspect trading activity occurred.
Based on TT Trade Surveillance best practices, clusters that score over 75 are deemed to be “high risk” and should be the primary focus of users during their compliance reviews.
Scorecard metrics
The Floor/Ceiling cluster scorecard includes metrics that help you determine if price manipulation may have occurred during the trading session.

The following metrics are provided:
- Session High — The high price for the instrument during the trading session.
- Session Low — The low price for the instrument during the trading session.
- Trdr Ssn Vol — The volume of trader's activity for the session.
- Trdr Ssn High Vol — The volume of trader's activity that matches the instrument's high price for the session.
- Trdr Ssn Low Vol — The volume of trader's activity that matches the instrument's low price for the session.
- Mkt Session Vol — The total trading volume for the session.
- Trdr Ask Vol Pct Vs Trdr Ssn Vol: — The percentage of ask volume compared to the trader's total volume for the session.
- Trdr Vol Vs Mkt Vol — The trader's percentage of volume for the total market volume.
- Trdr Pct High Vol Vs Mkt Vol — The percentage of volume of trader's activity that matches the instrument's high price for the session versus the total market volume.
- Trdr Pct High Vol Vs Trdr Ssn Vol: — The percentage of volume of trader's activity that matches the instrument's high price for the session versus the trader's total volume for the session.
- Trdr Pct Agg Vs Ssn Fill — Percent of trader's aggressive trades versus the session fills.
- Trdr High Fill Vs VAP High: — The volume of trader's activity that matches the instrument's high price for the session versus volume-at-price (VAP) at the same price level.
- VAP High Prc — The percentage of volume that matches the instrument's high price.
- Trd Cnt High Prc — Count of fill or partial fill actions at the high/low by the trader.
Identifying Floor/Ceiling
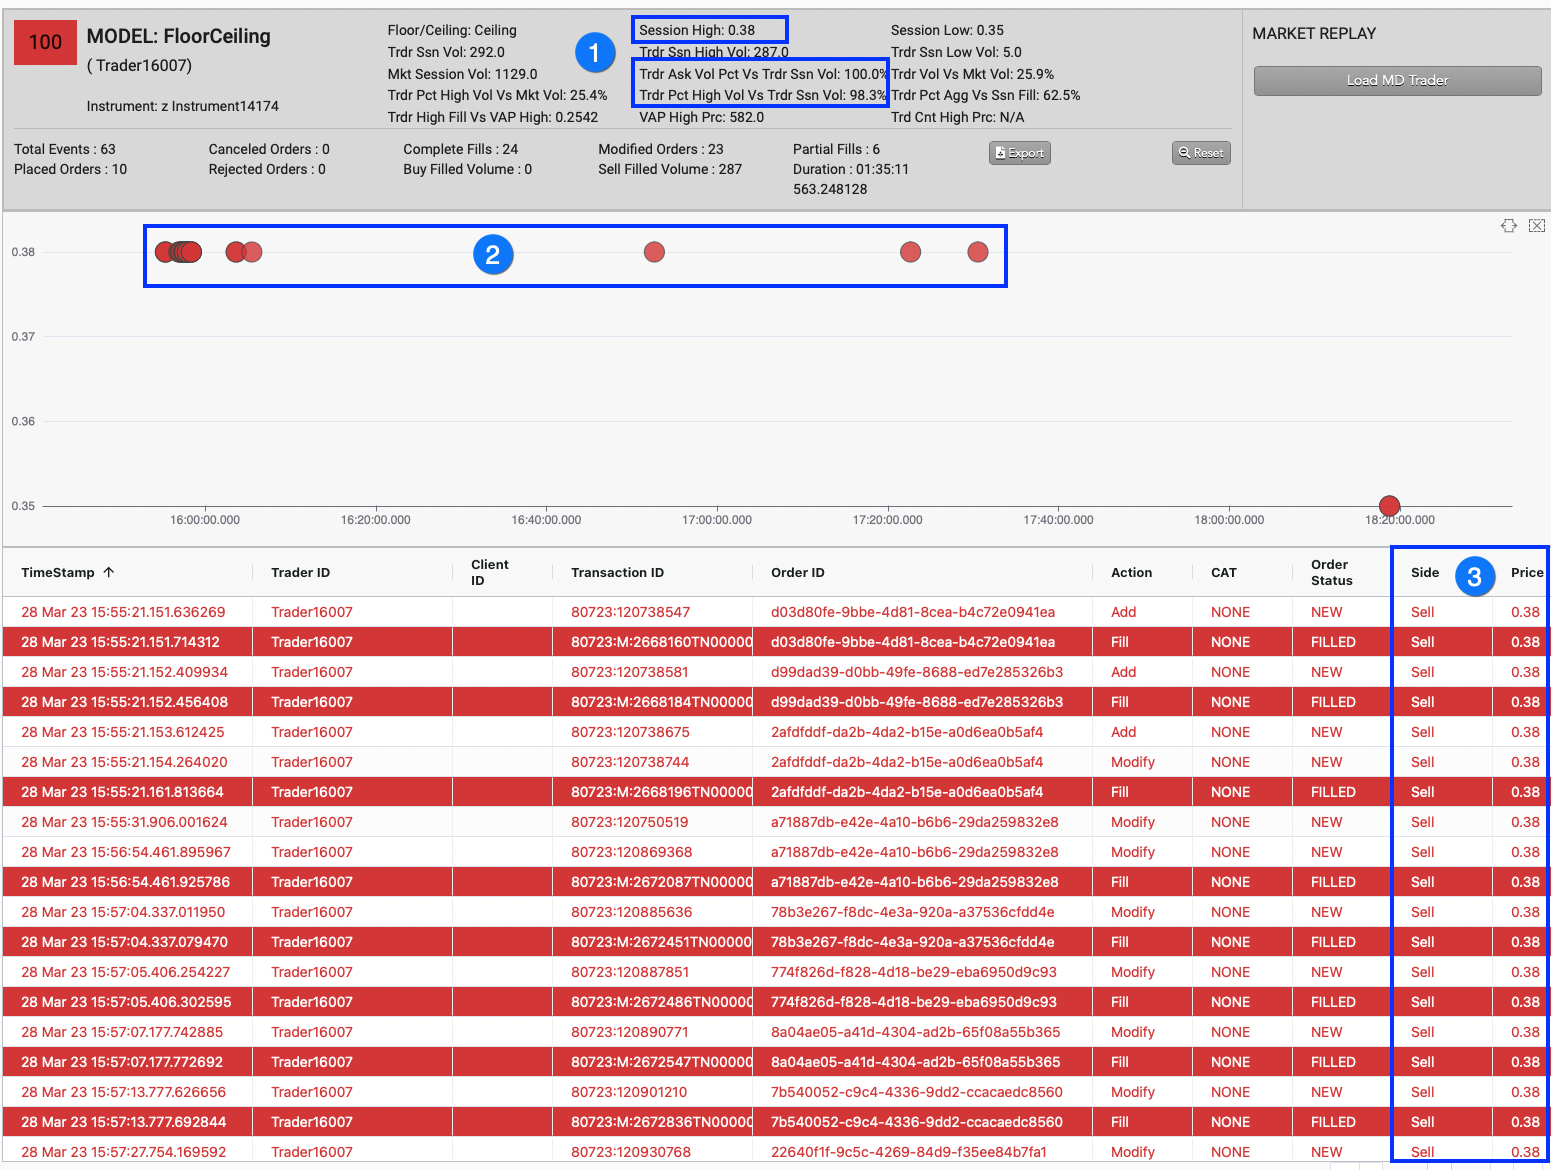
In addition to the scorecard metrics, the Floor/Ceiling chart and audit trail can also help identify suspicious trading activity. The following image shows results from inspecting a Floor/Ceiling trading cluster.
When investigating Floor/Ceiling clusters in TT Trade Surveillance, check for the following indications of potential price manipulation:
- Compare the trader's ask/bid volume percentage and the percent high/low volume with the session volume.
- In the chart, look for a high number of trades on one side (bid/ask) of the market that matches the Session high/low price level.
- In the audit trail, check if the trades occurred at the high/low price for the instrument.
