Market Abuse Models
Disruptive Order
The Disruptive Order model detects aggressive orders that instantly fill through multiple price levels. Causing rapid price moves by placing orders that are either too large or aggressively priced can be seen as disruptive trading behavior and may garner regulatory scrutiny.
Disruptive Order scoring methodology
Scoring of this model is primarily based on the number of price levels traded through in an aggressive manner. There are smaller scaled reductions in Score for extremely small price moves in relation to the instrument price, and for low percentages of aggressive fills.
Disruptive Order scorecard metrics
The Scorecard Metrics section measures the following statistics related to a Disruptive Order:
-
Aggressor Fill Pct: The percentage of trader volume that filled aggressively.
Note Applies to exchanges that have an aggressor fill tag.
-
Aggressor Fill Qty: The quantity of aggressive order fills.
Note Applies to exchanges that have an aggressor fill tag.
- Buy Fill Ratio: The ratio of Buy fills to total fills.
- Disruption Fill Qty: The quantity of the disruptive order that was filled.
- Pct Tot Ticks Moved: "Ticks Moved" divided by "Ticks Btwn HighLow".
- Price Levels: Number of price levels at which the aggressive order was filled. The sequence of price levels at which fills occur corresponds to the movement in the market price.
- Price Pct Change: Percent of price change resulting from the disruptive order.
- Prices: The list of fill prices in ascending or descending order.
- Sell Fill Ratio: The ratio of Sell fills to total fills.
- Session High: The highest price for the instrument during the session.
- Session Low: The lowest price for the instrument during the session.
- Side: Indicates which side of the trade the disruptive order is (Buy or Sell).
- Ticks Btwn HighLow: Total amount of ticks between the high and low price of the session.
- Ticks Moved: Amount of ticks the price moved through due to the traders activity.
- Ticks Size: Pricing increment of the instrument.
- VWAP Buy: The average traded price of an instrument based on Buy volume and price.
- VWAP Sell: The average traded price of an instrument based on Sell volume and price.
Identifying a Disruptive Order
If the Disruptive Order model displays multiple price levels for a cluster, this may indicate that the trader is attempting to ignite a price movement in a particular direction (Buy or Sell) to mislead other market participants or create an artificial price.
When investigating Disruptive Order clusters with TT Trade Surveillance, consider the following:
- The number of price levels at which the aggressive order was filled.
- Any trader activity immediately before or after the disruptive order
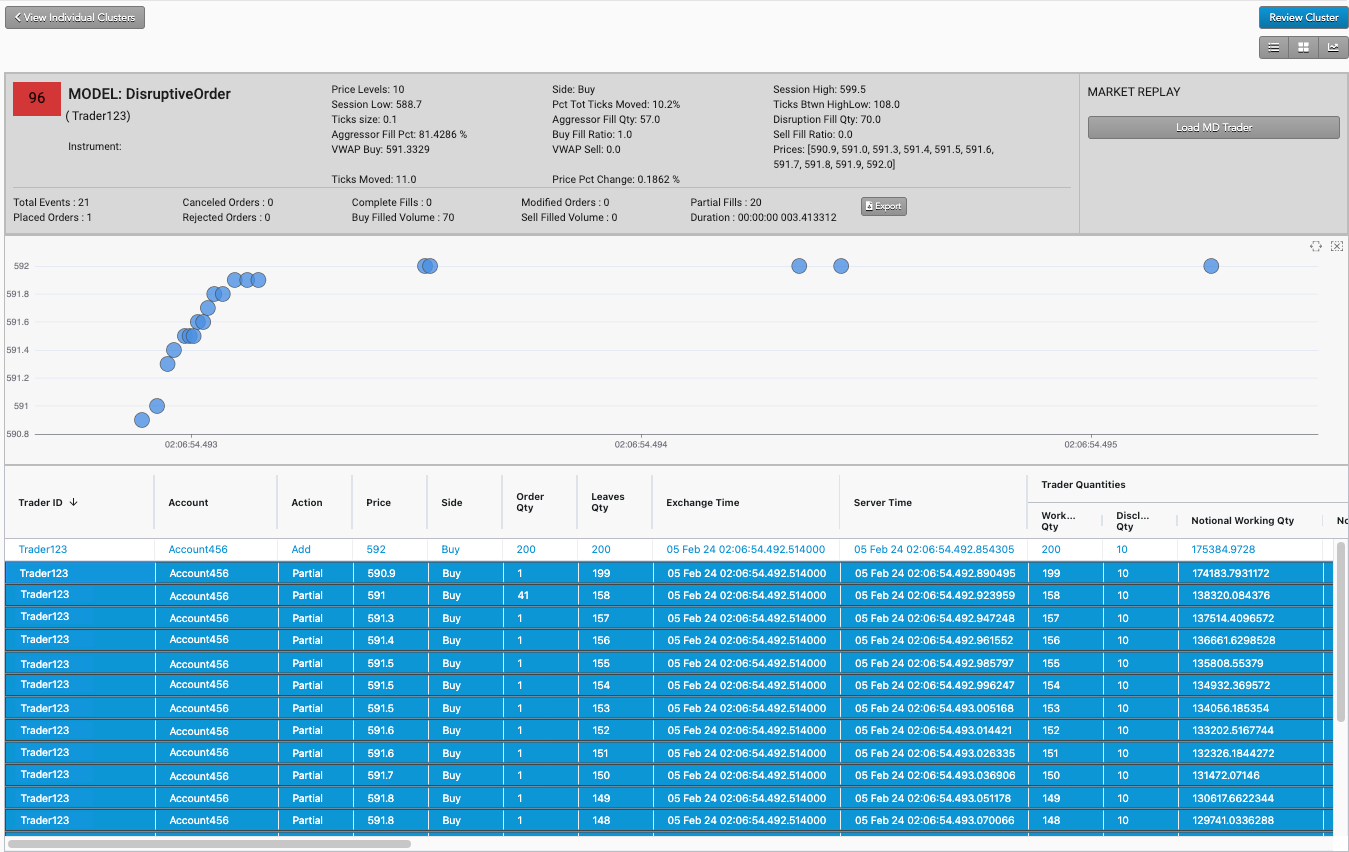
Using the Cluster Scorecard, you can analyze the activity that triggered the high cluster score. The pressure chart on the scorecard provides visual clues about the potential suspect trading pattern. The audit trail data on the scorecard can be used to verify order information and timing of the activity. The following example shows trading activity identified as a potential Disruptive Order.

In this example:
- The chart shows a series of blue bubbles at sharply increasing prices over a short period of time.
- The "Action" column in the audit trail shows that a large order received many partial fills across many price levels in a short time span.
- The "Price" column shows the aggressive buy order was placed above the market.