Market Abuse Models
Front Running
Front Running is an attempt to leverage insider knowledge of a future transaction to benefit from the impact to an instrument's price. For example, a trader may submit their own trades before or after submitting a larger trade for one of their clients. The trader then benefits from the change in price due to the client's trade.
The Front Running model detects an outlier point in time where significant changes in volume and price occur. From this point in time, the model can determine if a company's trader(s) benefited from the outlier event earlier and/or later in the trading session.
Front Running scoring methodology
To detect potential Front Running, TT Trade Surveillance identifies minute bars where market volume exceeds a set percentile threshold (using all minute bars for that instrument in the clusters session) while the price of the instrument also moves significantly during the same minute. These outlier bars are indicated with a thin black outline of the green market volume bar in the chart. Minute candles are also displayed on the same chart and are lined up with the bar volumes of their respective minutes.
The Front Running model then determines if the company submitted a high portion of the volume during the outlier event, indicating that the company's trading was a driver of the volume and price move outlier. Next, the model looks at different features of the company's trading before, during and after the outlier, such as potential profit, aggressiveness and total price move to help inform the scoring.
The Front Running score is based on a sliding scale between 0-100. For example, a cluster score of "75" indicates that the company had trades that seemed to benefit from a larger outlier event.
Front Running scorecard metrics
The Scorecard Metrics section measures the following statistics related to Front Running:
- acct_clust_sum_fillVol: The total buy and sell fill volume for the entire cluster, list by trading account.
- comp_clust_count_traderAcct: The number of trader/account combinations that appear within the cluster.
- comp_clust_pct_mktVol_on_aggr_side: The company's percentage of the market (candle) volume on the "aggressive" side of the market (i.e., the side getting filled in with more liquidity-taking trades).
- comp_clust_pct_vol_aggr_flagged: The company's percentage of volume flagged as aggressive.
- comp_clust_sum_mktVol: The company's total sum of the market (candle) volume.
- comp_outlierBar_pct_mktVol: The company's percentage of market (candle) volume during the outlier event.
- comp_sod_num_position: The company's start-of-day position as calculated by TT Trade Surveillance.
- mkt_outlierBar_delta_ticks: Outlier event's price change, listed in ticks.
- trader_clust_sum_fillVol: The total sum of filled buy and sell volume listed by trader.
- trader_prepos_pct_mktVol: The trader's percentage of market volume in the pre-positioning phase.
- traderAcct_clust_sum_fillVol: The total sum of filled buy and sell volume listed by trader/account.
Identifying Front Running
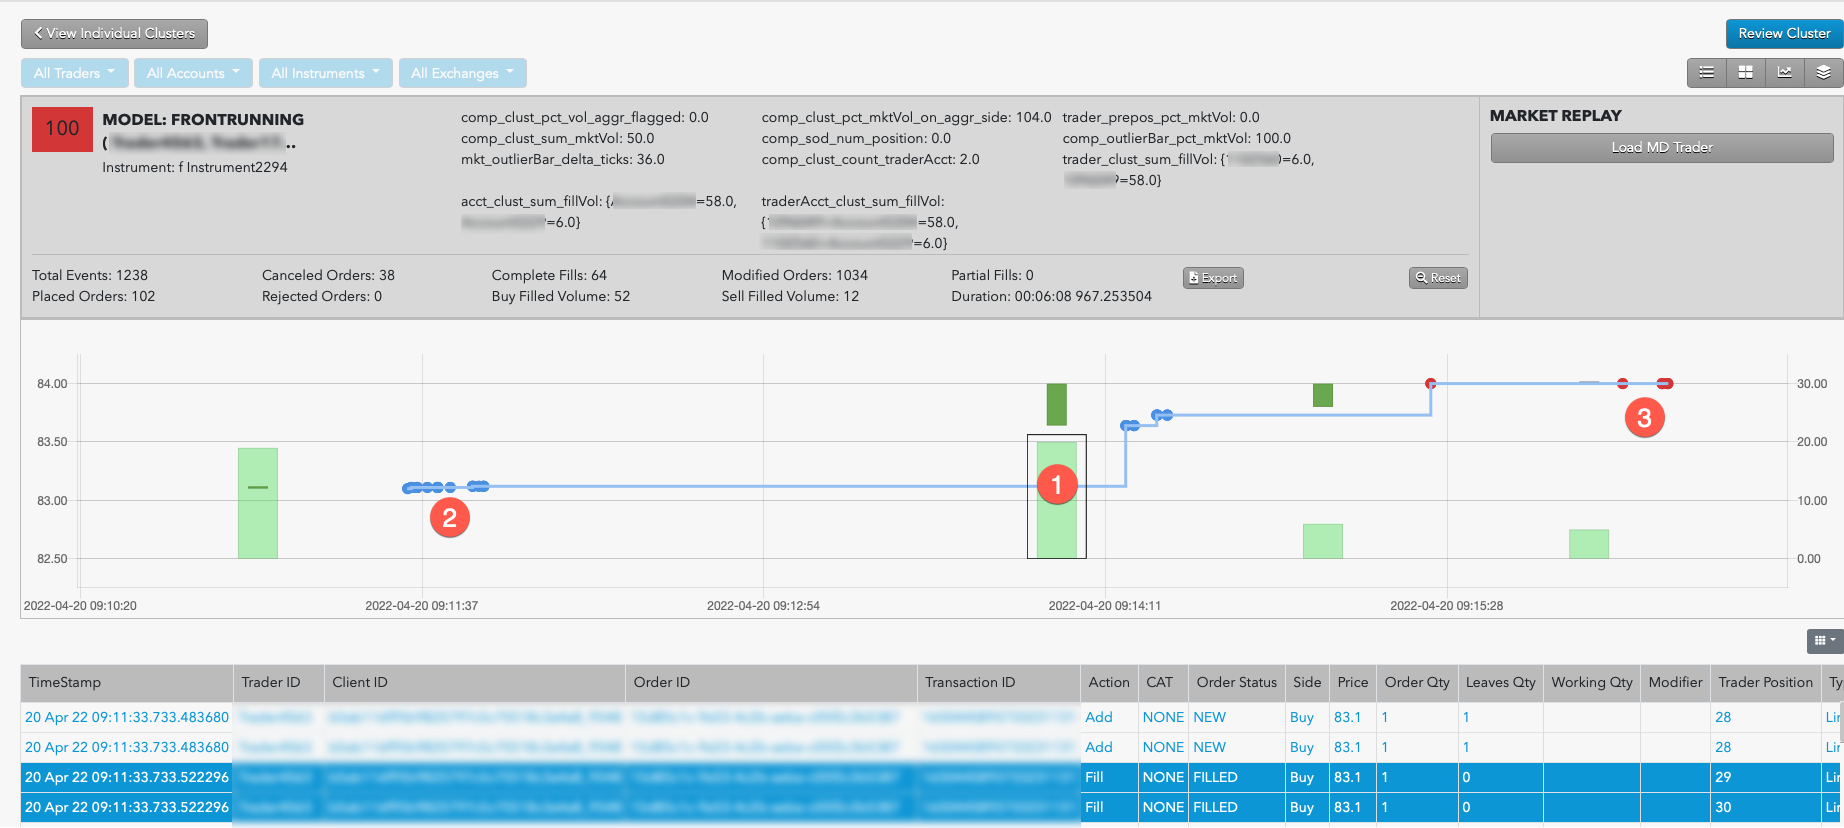
The Front Running model displays all large volume events as green candles. The outlier event displays as a green candle surrounded by a thin black box. The model also displays the relevant trades as blue dots for buys and red dots for sells. The model connects the relevant trades to the outlier event using a light blue line to highlight the connection.
When investigating Front Running clusters with TT Trade Surveillance, consider the following:
- The activity highlighted in the outlier event.
- The aggressive score of trading activity before and after the outlier event.
Using the Cluster Scorecard, you can analyze the activity that triggered the high cluster score. The highlighted outlier event provides visual clues about the potential suspect trading pattern. The audit trail data on the scorecard can be used to verify order information and timing of the activity. The following example shows trading activity identified as potential Front Running.

In this example:
- The outlier event shows a high volume of buy orders that causes an increase the instrument's price.
- Prior to the outlier event, the trader filled a number of buy orders at a lower price.
- Following the outlier event, the trader filled a number of sell orders at the higher price.