Market Grid
Opening Widgets in the Market Grid
In the Market Grid, you can open a widget as one of the following:
- a stand-alone widget
- a linked widget
Using a stand-alone widget
A stand-alone widget is populated with market data for an instrument selected in the Market Grid.
To use a stand-alone widget:
-
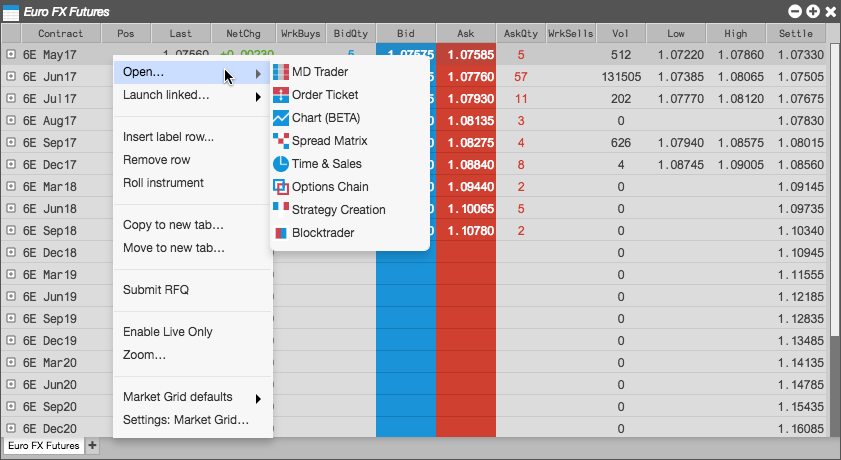
Right-click on an instrument row and select Open to show a list of widgets that can be opened from the Market Grid.
Note: You may select and right-click multiple instrument rows to view multiple legs inside a single Spread Matrix. For more information, refer to Opening the Spread Matrix from the Market Grid.
-
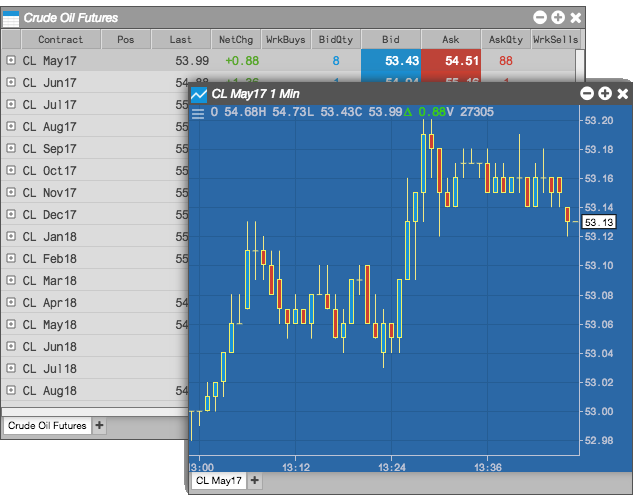
Click on a widget (e.g., Chart) to select it.
The widget opens and is seeded with market data for the selected instrument.
Using a linked widget
A linked widget is populated with market data for a selected instrument, but updates automatically when you select other instruments in the Market Grid.
To use a linked widget:
-
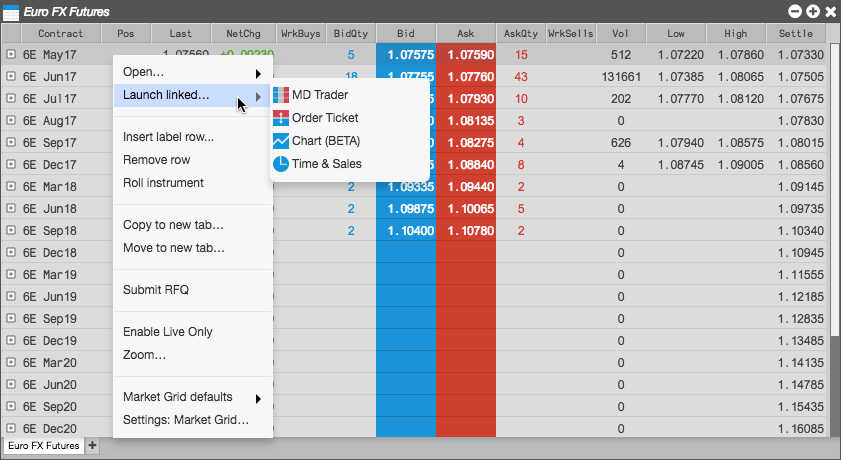
Right-click on an instrument row and select Launch linked... to show a list of widgets that can be linked to the Market Grid.
-
Click on a widget (e.g., Time & Sales) to select it.
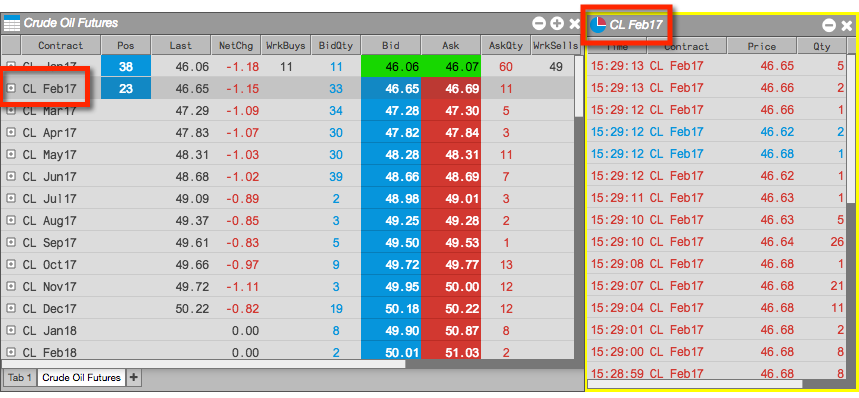
The linked widget opens with a yellow border.
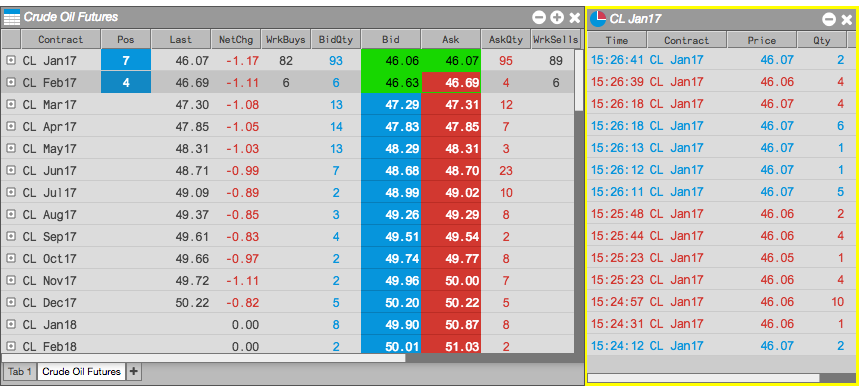
-
In the Market Grid, click a different instrument (e.g., CL Feb17) to select it.
The linked widget (e.g., Time & Sales) now contains the market data for the selected instrument.