Market Grid
Market Grid Display
There are settings and options available in the Market Grid widget that provide the ability to visualize instruments and market data activity.
The following display options are available:
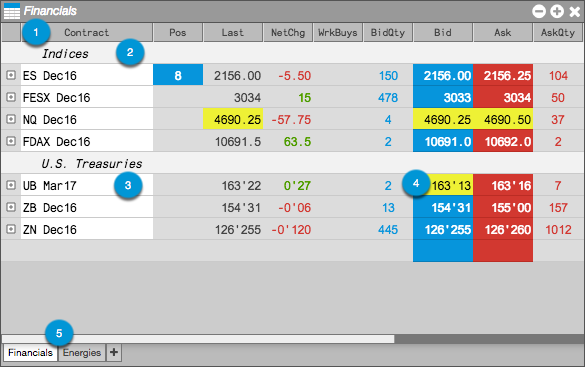
- Columns — Show or hide columns that are specific to your markets or instruments.
- Label Rows — Provide visual cues in a grid with many rows.
- Color rows by year — Differentiate instruments expiring in successive 12-month cycles.
- Highlight Updates — Highlight the Last, Bid, and Ask values when price updates occur.
- Tabs — Organize your instruments by showing and using tabs.