チャート
RAVI
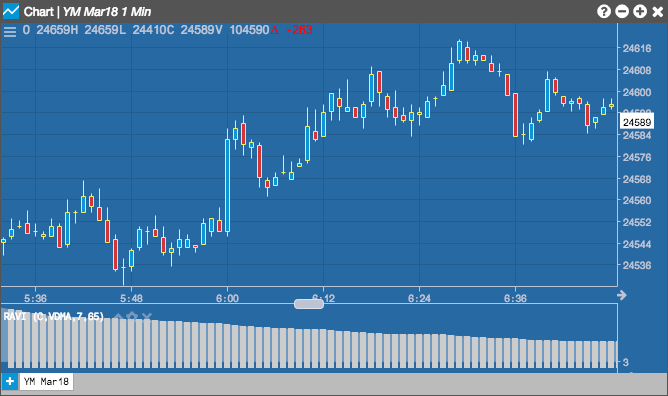
RAVI 指標は、現在の価格と過去の価格の間のパーセント数差分を示し、市場のトレンドを識別します。この指標は、異なった長さの移動平均に基づいて計算します。
Configuration Options
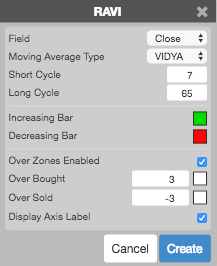
- 欄: 平均計算のベースに使用する価格、または価格の組み合わせ。以下の値があります。
- Open (始値)
- High (高値)
- Low (安値)
- Close (終値)
- Adjusted Close (調整終値)
- HL/2 \( \left ( \frac{High + Low}{2} \right ) \)
- HLC/3 \( \left ( \frac{High + Low + Close}{3} \right ) \)
- HLCC/4 \( \left ( \frac{High + Low + Close + Close}{4} \right ) \)
- OHLC/4 \( \left ( \frac{Open + High + Low + Close}{4} \right ) \)
- Moving Average Type: Type of moving average to use in the calculations:
- Simple: Mean (average) of the data.
- Exponential: Newer data are weighted more heavily geometrically.
- Time Series: Calculates a linear regression trendline using the “least squares fit” method.
- Triangular: Weighted average where the middle data are given the most weight, decreasing linearly to the end points.
- Variable: An exponential moving average with a volatility index factored into the smoothing formula. The Variable Moving average uses the Chande Momentum Oscillator as the volatility index.
- VIDYA: An exponential moving average with a volatility index factored into the smoothing formula. The VIDYA moving average uses the Standard Deviation as the volatility index. (Volatility Index DYnamic Average).
- Weighted: Newer data are weighted more heavily arithmetically.
- Welles Winder:The standard exponential moving average formula converts the time period to a fraction using the formula EMA% = 2/(n + 1) where n is the number of days. For example, the EMA% for 14 days is 2/(14 days +1) = 13.3%. Wilder, however, uses an EMA% of 1/14 (1/n) which equals 7.1%. This equates to a 27-day exponential moving average using the standard formula.
- Hull: The Hull Moving Average makes a moving average more responsive while maintaining a curve smoothness. The formula for calculating this average is as follows: HMA[i] = MA( (2*MA(input, period/2) – MA(input, period)), SQRT(period)) where MA is a moving average and SQRT is square root.
- Double Exponential: The Double Exponential moving average attempts to remove the inherent lag associated to Moving Averages by placing more weight on recent values.
- Triple Exponential: TBD
- Simple
- Exponential
- Time Series
- Triangular
- Variable
- VIDYA
- Weighted
- Welles Winder
- Hull
- Double Exponential
- Triple Exponential
- Short Cycle (ショート サイクル): 長期移動平均期間の長さ。
- Long Cycle (ロング サイクル): 短期移動平均期間の長さ。
- Color Selectors (配色セレクター): グラフ要素に使用する配色。
- Over Zones Enabled (オーバーゾーンの有効化): 描画と水平線の過剰買と過剰売のレベル間でエリアを網掛けするかどうかを示します。
- Over Bought (過剰買): 過剰の買枚数。
- Over Sold (過剰売): 過剰の売枚数。
- Display Axis Label (軸ラベルの表示): Y 軸に最新値を表示するかどうか。
数式
\[ RAVI = \frac{100 * (n{\text -}period\;short\;moving\;average - n{\text -}period\;long\;moving\;average)}{n{\text -}period\;long\;moving\;average} \]