チャート
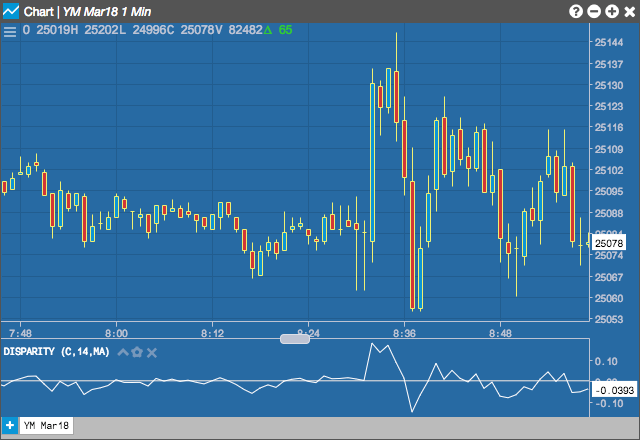
ディスパリティ インデックス
ディスパリティ インデックス (Disparity Index) 指標は、指定した移動平均に対して最新の終値の相対ポジションを測定し、パーセント数で値を記録します。0 以上の値は、アセットが上向きのモメンタムで得ている一方、0 以下の値は、売りの圧力が上昇している兆候として解釈できます。
Configuration Options
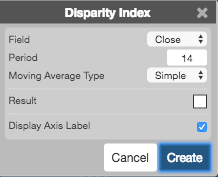
- 欄: 平均計算のベースに使用する価格、または価格の組み合わせ。以下の値があります。
- Open (始値)
- High (高値)
- Low (安値)
- Close (終値)
- Adjusted Close (調整終値)
- HL/2 \( \left ( \frac{High + Low}{2} \right ) \)
- HLC/3 \( \left ( \frac{High + Low + Close}{3} \right ) \)
- HLCC/4 \( \left ( \frac{High + Low + Close + Close}{4} \right ) \)
- OHLC/4 \( \left ( \frac{Open + High + Low + Close}{4} \right ) \)
- Period (ピリオド): 計算で使用されるバー数。
- Moving Average Type: Type of moving average to use in the calculations:
- Simple: Mean (average) of the data.
- Exponential: Newer data are weighted more heavily geometrically.
- Time Series: Calculates a linear regression trendline using the “least squares fit” method.
- Triangular: Weighted average where the middle data are given the most weight, decreasing linearly to the end points.
- Variable: An exponential moving average with a volatility index factored into the smoothing formula. The Variable Moving average uses the Chande Momentum Oscillator as the volatility index.
- VIDYA: An exponential moving average with a volatility index factored into the smoothing formula. The VIDYA moving average uses the Standard Deviation as the volatility index. (Volatility Index DYnamic Average).
- Weighted: Newer data are weighted more heavily arithmetically.
- Welles Winder:The standard exponential moving average formula converts the time period to a fraction using the formula EMA% = 2/(n + 1) where n is the number of days. For example, the EMA% for 14 days is 2/(14 days +1) = 13.3%. Wilder, however, uses an EMA% of 1/14 (1/n) which equals 7.1%. This equates to a 27-day exponential moving average using the standard formula.
- Hull: The Hull Moving Average makes a moving average more responsive while maintaining a curve smoothness. The formula for calculating this average is as follows: HMA[i] = MA( (2*MA(input, period/2) – MA(input, period)), SQRT(period)) where MA is a moving average and SQRT is square root.
- Double Exponential: The Double Exponential moving average attempts to remove the inherent lag associated to Moving Averages by placing more weight on recent values.
- Triple Exponential: TBD
- Simple
- Exponential
- Time Series
- Triangular
- Variable
- VIDYA
- Weighted
- Welles Winder
- Hull
- Double Exponential
- Triple Exponential
- Color Selectors (配色セレクター): グラフ要素に使用する配色。
- Display Axis Label (軸ラベルの表示): Y 軸に最新値を表示するかどうか。
数式
\[ DI = \frac{C-Mov(C,X,MA)}{Mov(C,X,MA) \times 100} \]