Watchlist
Watchlist reference
Available settings
These settings affect only the selected Watchlist widget. To update the default settings with these value for newly-opened Watchlist widgets, or to apply them to existing opened widgets, click Defaults.

Display settings
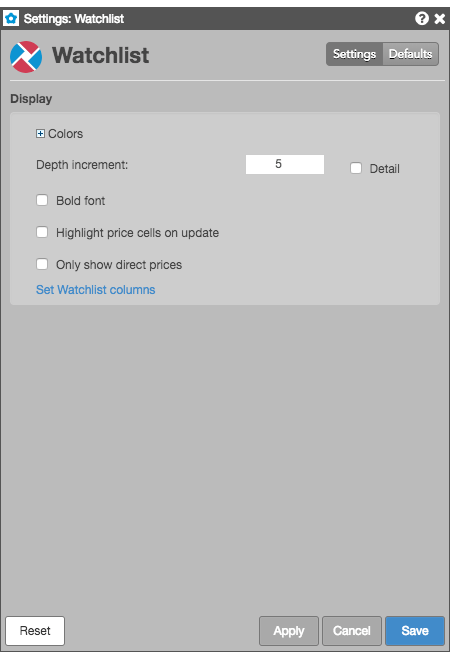
- Grid font size: Adjust the font size to suit your preferences and use bold text, if desired.
- Colors: Allows you to customize or change the cell and column colors available in the widget.
- Bold font: Sets whether to use bold font for text.
- Depth increment: Set the number of additional depth levels to show or hide when displaying market depth for an instrument.
- Highlight price cells in update: Enable this setting to highlight a price cell every time it updates.
- Only show direct prices — When this setting is checked (enabled), implied prices are filtered out and only direct prices are shown, and implied bid and ask quantities are not included in the best bid and ask quantities. When unchecked (disabled), best bid and ask prices and quantities include both direct and implied values.
- Set Watchlist columns: Select the columns you want shown in the Market Grid.
Watchlist column descriptions
| Column | Description |
|---|---|
| Instrument | Options instrument |
| % Chg | The percentage of net change between the last traded price and the previous session's Settle price. Note: For instruments that support decimal quantities, e.g., GDAX, the net change is calculated as a continuous 24-hour net change based on the price from 24 hours ago. |
| ADelta | Delta calculated using the best Ask price. |
| AGamma | Gamma calculated using the best Ask price. |
| AIV | Implied volatility calculated using the best Ask price. |
| ARho | Rho calculated using the best Ask price. |
| ATheta | Theta calculated using the best Ask price. |
| AVega | Vega calculated using the best Ask price. |
| Ask | The best market ask price. |
| AskCnt | Shows the number of orders comprising the total ask quantity at a price level. |
| AskQty | The total quantity working at the ask. |
| BDelta | Delta calculated using the best Bid price. |
| BGamma | Gamma calculated using the best Bid price. |
| BIV | Implied volatility calculated using the best Bid price. |
| BRho | Rho calculated using the best Bid price. |
| BTheta | Theta calculated using the best Bid price. |
| BVega | Vega calculated using the best Bid price. |
| Bid | The best market ask price. |
| BidCnt | Shows the number of orders comprising the total ask quantity at a price level. |
| BidQty | The total quantity working at the ask. |
| Buy Edge | Difference between the best ask and the theoretical value. |
| Close | The closing price for the session. |
| Contract | The name and contract expiry for the instrument or strategy. |
| Depth Toggle | Shows/hides the market depth expander for all instruments. |
| Description | The full name of the product for each contract. |
| Exch | Name of the exchange. Note: For parent TT order type orders, an asterisk "*" is appended to the exchange name in this column (e.g., CME *) to indicate the intended destination of the submitted parent order. No asterisk appears in the Exch column for the related child orders sent to the exchange. |
| ExpDate | The contract expiration date. If an option to buy or sell the underlying is exercised, it must be exercised on the expiration date or anytime prior to the expiration date depending on the type of contract. |
| High | The high price for the session. |
| High | The high price for the session. |
| IDelta | The delta calculated with the auto-fit volatility curve values provided by TT. |
| IGamma | Gamma calculated using implied volatility. |
| IRho | Shows the change in options value per change in interest rate. Based on TT auto-fit volatility curve values. |
| ITheta | Shows the change in options value per change in time, which is also known as time decay. Based on TT auto-fit volatility curve values. |
| IV | Implied volatility value. Implied volatilities are calculated using the midpoint of bid and ask prices. |
| IVega | Shows the change in options value per change in volatility based on the TT auto-fit volatility curve. |
| ImpAskQty | The implied ask quantity. |
| ImpBidQty | The implied bid quantity. For aggregated instruments, the implied bid quantity of each outright is displayed, and the sum of the implied bid quantities from each outright is displayed for the aggregated instrument. |
| ImpBidQty | The implied bid quantity. For aggregated instruments, the implied bid quantity of each outright is displayed, and the sum of the implied bid quantities from each outright is displayed for the aggregated instrument. |
| IndPrc | Indicative price. Shows the indicative (open/close) price received from the exchange, as well as the equilibrium price during the Auction and Circuit Breaker states. |
| IndSettle | Indicative settle representing the last settlement price received from the exchange |
| Last | The last traded price. |
| LastQty | Quantity of the last executed trade. |
| Low | The low price for the session. |
| NetChg | The net change difference between the last traded price and the previous session's Settle price. Note: For instruments that support decimal quantities, e.g., GDAX, the net change is calculated as a continuous 24-hour net change based on the price from 24 hours ago. |
| Open | The opening price for the session. |
| Pos | Net open position in an instrument. |
| SDelta | Delta calculated using the settlement volatility. |
| SGamma | Gamma calculated using the settlement volatility. |
| SRho | Rho calculated using the settlement volatility. |
| STheta | Theta calculated using the settlement volatility. |
| SV | Settlement volatility value, which indicates volatility calculated per strike using settlement prices. |
| SVega | Vega calculated using the settlement volatility. |
| Sell Edge | Difference between the best bid and the theoretical value. |
| Settle | The settlement price from the previous session. |
| Status | The current status of the exchange:
|
| TT Delta | Delta calculated using the TT-calculated volatility. |
| TT Gamma | Gamma calculated using the TT-calculated volatility. |
| TT Rho | Rho calculated using the TT-calculated volatility. |
| TT Theta | Theta calculated using the TT-calculated volatility. |
| TT V | The TT calculated theoretical value based on the auto-fit volatility curve values. |
| TTVega | Vega calculated using the TT-calculated volatility. |
| Time | The time the order action occurred. This value is updated after each order action.
|
| Type | The type of instrument or options strategy. |
| UDelta | Delta calculated using the user-defined volatility. |
| UGamma | Gamma calculated using the user-defined volatility. |
| URho | Shows the change in options value per change in interest rate. Based on user-defined volatility curve values. |
| UTheta | Shows the change in options value per change in time, which is also known as time decay. Based on user-defined volatility curve values. |
| UV | User volatility values that are used for calculating theoretical call and put values. These user-defined vols are entered using the Vol Curve Manager, which fits the curve to the control points on the volatility curve. The user volatility values are a result of the fitting process. |
| UVega | Shows the change in options value per change in volatility based on the user-defined volatility curve. |
| Vol | The total traded quantity for the session. |
| WrkBuys | The total quantity of working buy orders for an instrument. If market depth is displayed, the working quantities are displayed for each price. Columns display the quantities of and floating order book access to working orders. If market depth is displayed, the working quantities are displayed for each price. |
| WrkSells | The total number of working orders at the ask price. At the best ask price, the total number of working sell orders for all levels of depth is also displayed. Columns display the quantities of and floating order book access to working orders. If market depth is displayed, the working quantities are displayed for each price. |
| Γ/Θ | Is a measure of how much money you will gain by owning the option due to movements in the underlying versus how much money you will lose in time decay (theta). Also known as epsilon. |
Selective defaults
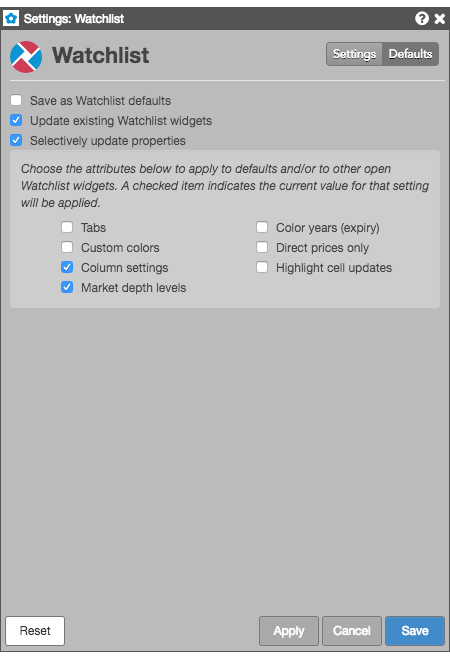
Watchlist lets you select individual customizations to save as default Watchlist settings and to update existing Watchlist widgets, while applying other customizations to the current widget. Checking either of the Save as Watchlist defaults or Updating existing Watchlist widgets settings enables the Selectively update properties setting. You can choose the individual widget attributes you want to save.
