Advanced concepts
Time Series Bars for OHLC and VWAP Values
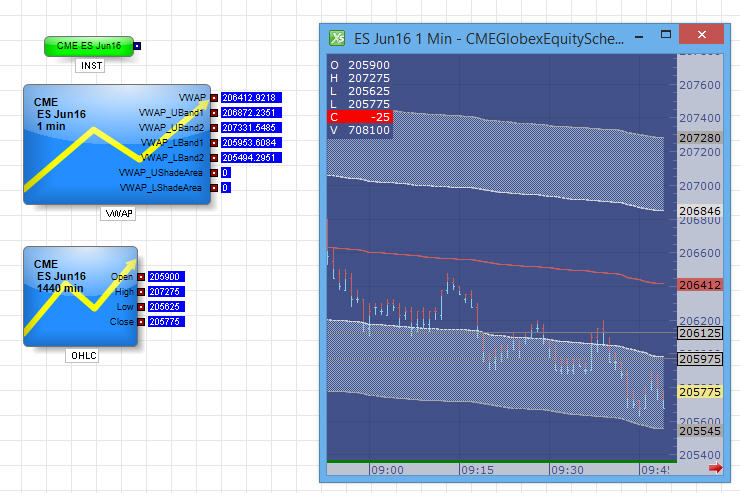
ADL allows a number of ways to create technical indicators. In this article, we focus on creating time series bars for OHLC (Open, High, Low, Close) and VWAP (Volume Weighted Average Price indicators).
This first ADL Canvas leverages the Analytics block to update the time series bars at 1 Minute Time intervals.

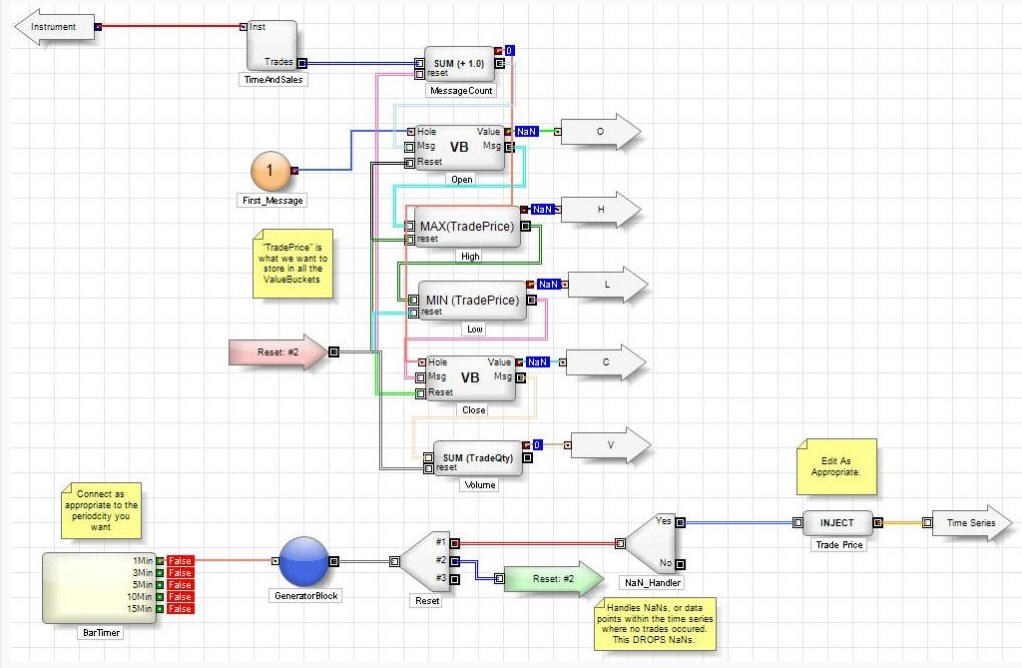
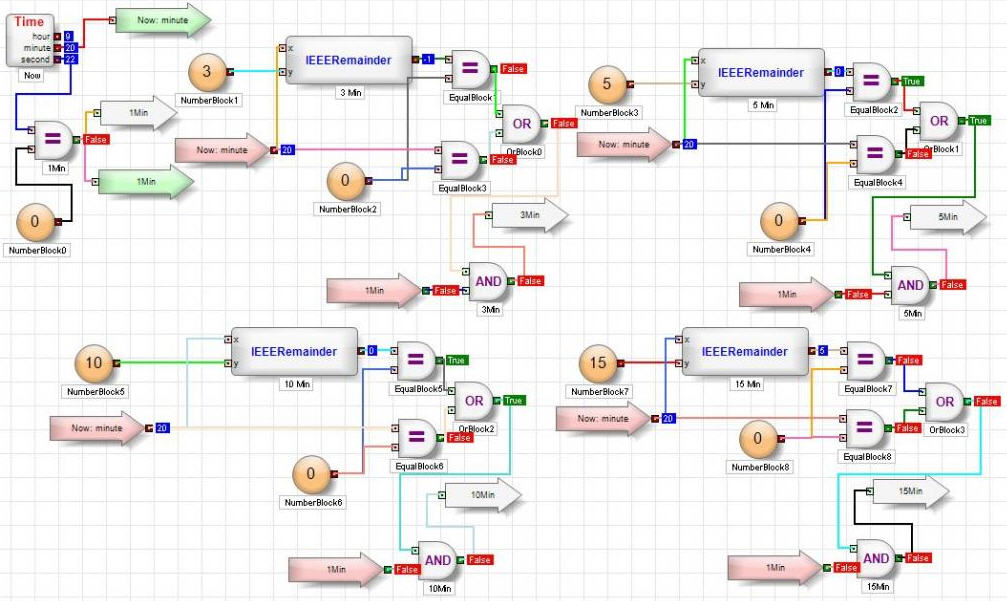
You can compare this method with creating the OHLC using the Time and Sales block and having a boolean condition trigger for the various "Time Series" calculations.


In addition, the following code sample illustrates a method for building and storing 1 min OHLC values. In this example the past 4 bars are tracked as well as the current activity. The values are calculated off the Time and Sales block with snapshots taken every minute so it takes 4 minutes for the bar data to be loaded. If there is a 1 min period where nothing trades, a snapshot for that period will not be taken. Also, block trades have been filtered out from the time and sales feed.