Trader Analytics
Trader Analytics Reference
Available settings
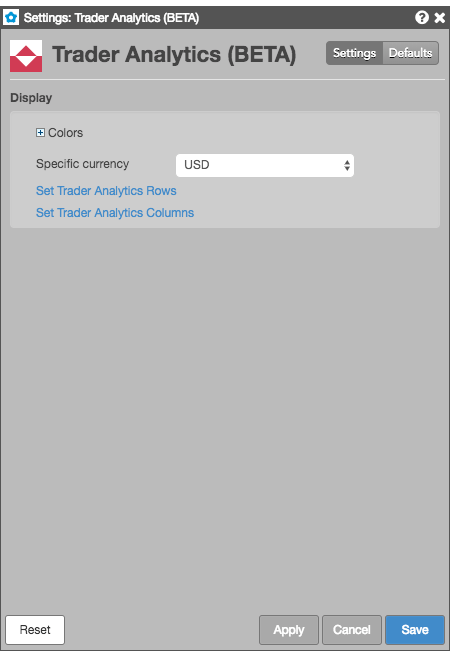
To access settings, right-click in Trader Analytics to open the context menu and select Settings: Trader Analytics.
These settings affect only the selected Trader Analytics widget. To update the default settings with these value for newly-opened Trader Analytics widgets, or to apply them to existing opened widgets, click Defaults.

- Colors — Allows you to customize or change the cell and column colors available in the widget.
- Specific currency — Allows you to select a currency, which automatically recalculates the values displayed in the Trader Analytics grid based on the currency selection.
- Set Trader Analytics Rows — Allows you to show/hide each row of performance statistics.
- Set Trader Analytics Columns — Allows you to show/hide each column in Trader Analytics.
Trader Analytics row and column descriptions
The following tables describe the trading performance statistics columns and rows displayed in Trader Analytics:
| Trader Analytics Columns | |
| Column Name | Description |
| Total | The total trading activity for the selected instrument. This is a cumulative column that contains data for all trades for that instrument. The “Round Trips” and “Net P/L” values in this column should match the values in the Fills widget, assuming the currencies are the same. |
| Long | Displays all trading information regarding long trades. |
| Short | Displays all trading information regarding short trades. |
| Trader Analytics Rows | ||
| Field Name | Field Type | Description |
| Closed P/L | Currency | This is the total amount of money made or lost on closed positions before transaction fees have been deducted. |
| Open Position | Integer | Displays position as either long(+), short(-), or flat (0). |
| Total Winning Trade $ | Integer | Shows the total amount of money made on profitable trades. |
| Total Losing Trade $ | Integer | Shows the total amount of money lost on losing trades. |
| Avg Win $ | Currency | This is the average amount of money made per winning trade. |
| Avg Loss $ | Currency | This is the average amount of money lost per losing trade. |
| Total Trades | Integer | Displays the total number of trades. |
| Total Traded Lots | Integer | Displays the total number of lots traded. |
| Profit Index | Integer | Displays an index calculated as: Profit Index = (# winning trades/# total trades)*(Avg Win$/ABS(Avg Loss$)) -(1-(# winning trades/# total trades))*(Avg Win$/ABS(Avg Loss$)) |
| Winning Trades | Integer | Shows the total number of profitable trades made. |
| Losing Trades | Integer | Shows the total number of losing trades made. |
| Scratch Trades | Integer | Shows the total number of trades on which money was neither made nor lost. |
| Max Consecutive Wins | Integer | Shows the maximum number of consecutive winning trades. |
| Max Consecutive Losses | Integer | Shows the maximum number of consecutive losing trades. |
| Largest Gain | Currency | Displays the amount of money made on the most profitable trade. |
| Largest Loss | Currency | Displays the amount of money lost on the biggest losing trade. |
| Avg Total Hold Time | Time | The average amount of time that the trader is holding onto trades. |
| Avg Hold Time Winners | Time | The average amount of time that the trader is holding onto winning trades. |
| Avg Hold Time Losers | Time | The average amount of time that the trader is holding onto losing trades. |
| Avg Hold Time Scratch | Time | The average amount of time that the trader is holding onto breakeven trades. |
| Avg Time Between | Time | Shows the average amount of time the trader was inactive between trades. The numbers under “Winning” and “Losing” are meant to be the same thing, broken down by periods during which the trader had a positive cumulative P/L (Winning) or a negative cumulative P/L (Losing) for the selected instrument. |
| Longest Time Between | Time | The longest amount of time the trader was inactive between trades. |
| Shortest Time Between | Time | The shortest amount of time the trader was inactive between trades. |
| Avg Time After Losing | Time | The average amount of time the trader completed a trade after a losing trade. |
| Avg Time After Winning | Time | The average amount of time the trader completed a trade after a winning trade. |