Positions
Positions matrix view
The Positions widget provides a "matrix" view that shows positions rolled up per user-defined product group, as well as positions per expiry for each product in the group. The matrix can help you manage positions across many related products by displaying your long/short exposure in an aggregated view.
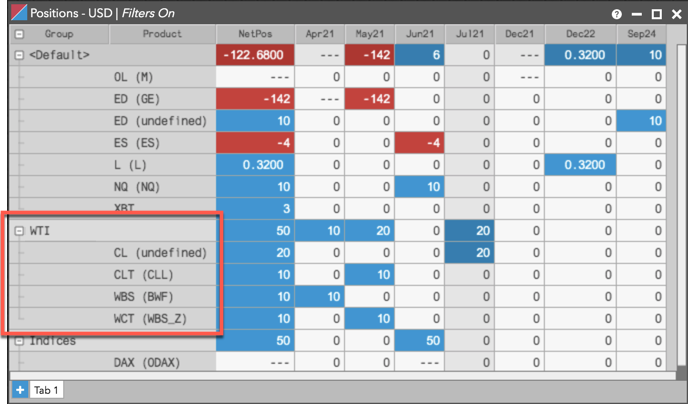
For example, you can create a custom "WTI" group made up of futures contracts traded at both CME and ICE (e.g., CME CL, CME CLT (TAS), ICE WBS and ICE WBS_Z).
To enter matrix view, right-click in the Positions widget and click View Mode | Matrix. When in matrix view, you can simply right click on product rows to create custom product groupings. You can also perform actions similar to the default aggregate view (e.g., right click to open an order entry widget or create a manual fill.)
Position matrix rows and columns
In matrix view mode, the Position widget displays grid rows for each product that you have a position in as a "default" group, as well as positions in any custom product groups.
In matrix view mode:
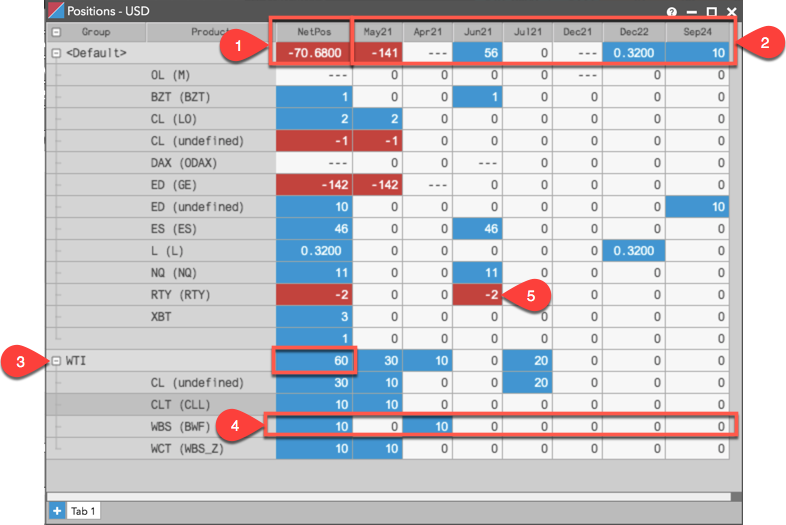
- The NetPos column displays the aggregate net position per product group. The value in the top row is the total net position for all product groups.
- The contract month columns display all available contract months for the products, even if you do not have positions in those months. Each column aggregates the position quantities per group.
- The first (left) column displays the product group names. Positions are aggregated by group.
- Group rows aggregate the net positions from products for each contract month.
- The position cells display with a blue (long) / red (short) cell background color.