Trading Crypto on TT
Viewing crypto market data on TT
You can view market data for crypto instruments in the MD Trader, Market Grid, Time and Sales, and Charts widgets.
Crypto market data in MD Trader
When viewing crypto market data in MD Trader, consider the following:
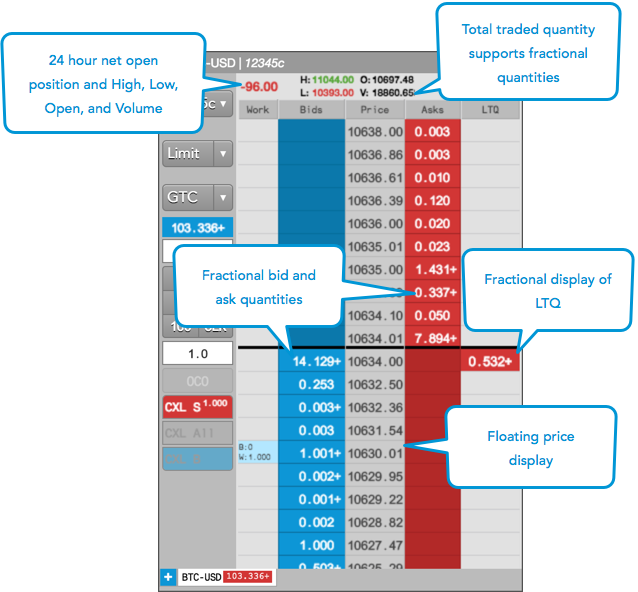
- For cryptocurrency exchanges that support fractional market quantities (such as Coinbase), working order quantities up to eight decimal places are supported in the Bids and Asks columns. LTQ is also displayed as a fractional quantity up to eight decimal places.
- Empty price levels can be hidden to show only available prices at each price level.
- Quantities default to three decimal places of precision, but can set to show 0-8 decimal places.
- Market data is displayed for a continuous 24 hour cycle (not daily or per trading session) as follows:
- Net change — Calculated as a continuous 24-hour net change based on the Open price from 24 hours ago.
- O (Open) — Shows the opening price of the instrument 24 hours ago.
- H (High) — Shows the highest price for the instrument in the last 24 hours.
- L (Low) — Shows the lowest price for the instrument in the last 24 hours.
- V (Volume) — Shows the total volume traded in the instrument over the last 24 hours.
The following example shows crypto market data displayed in MD Trader.
Floating price ladder
Empty price levels can be hidden to show only available prices by enabling Settings | Only show available prices in the MD Trader widget.
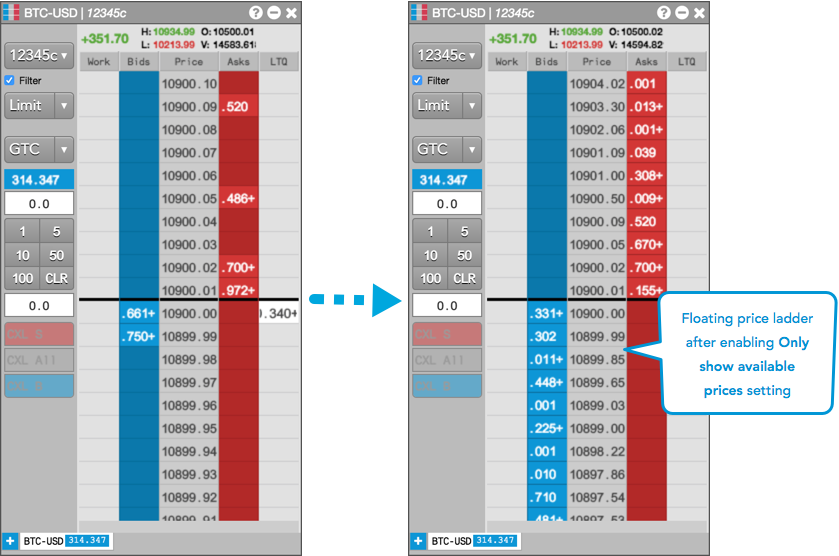
Note: This setting removes the static aspect of the ladder, which may result in orders being submitted at a price level different than the one you clicked on if the prices moved while in the process of clicking the mouse for order entry.
When "Only show available prices" is enabled, MD Trader briefly shows a blank cell where a price level is removed before it compresses and adjusts the price ladder. This allows you to to enter an order at the correct price before all the prices move, and helps to clearly show quick rallies or sell-offs in the market.
Tip: You can "freeze" prices on the ladder at any time by holding down the Shift key.
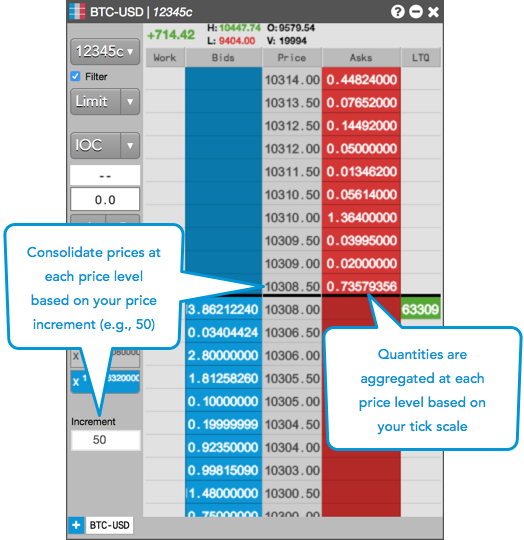
Price consolidation
You can consolidate prices at specific price increments by enabling the Settings | Price increment per row option in MD Trader. When enabled, aggregate order quantities between each price increment are displayed at each price level. For example, a price increment of "50" for Coinbase BTC-USD which trades in .01 increments results in prices displaying in .50 increments.
Quantity display
Quantities can be displayed with 0-8 decimals of precision using the Quantity display decimal places option in the Preferences | General tab. By default, this option is set to "3".
A "+" is shown after the last displayed decimal to indicate additional quantity
(e.g.,  ).
).
 .
.
The following fields will adhere to the "Quantity display decimal places" setting:
- The WrkBuys and WrkSells columns in the Market Grid
- MD Trader working order cells and LTQ
- Net positions in MD Trader and Market Grid
Note: Net position fields are not shown for TT Crypto users.
- The Qty column in Time and Sales
- Working order cells, LTQ, and net positions in Autospreader legs with instruments that support fractional quantities.
Note: The Order Book, Audit Trail, and Fills widgets will show the full quantity regardless of this setting.
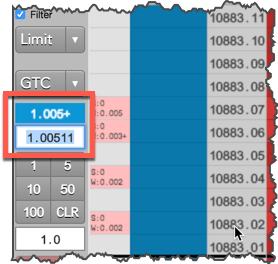
If you click a formatted quantity when "Quantity display decimal places" is enabled, the actual, full quantity will seed in the appropriate widget field. For example, if you click "1.005+"" in the Net Open Position field in the MD Trader order entry panel, then "1.00511" will be seeded in the order quantity field.
Crypto market data in Market Grid
When viewing crypto market data in the Market Grid, consider the following:
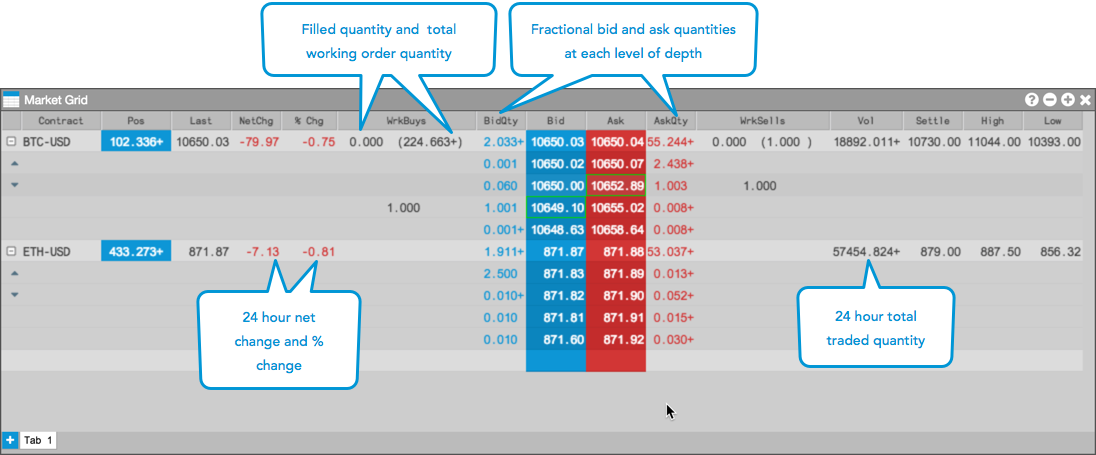
- The WkBuys and WrkSells columns display the fractional working quantity (in parentheses) and filled quantity to eight decimal places.
- The NetChg, % Chg, and Vol columns show 24 hour net change, percent change, and volume for the instrument based on a rolling 24 hour period.
- The Settle column shows the price in the final minute before the session rolls at 00:00 UTC (6:00 PM CST).
- Detailed depth only shows price levels with working order quantities by default.
- Optionally, prices can be displayed with 0-8 decimal places. Any quantity above the displayed amount is indicated with a "+".
The following example shows crypto market data displayed in the Market Grid:
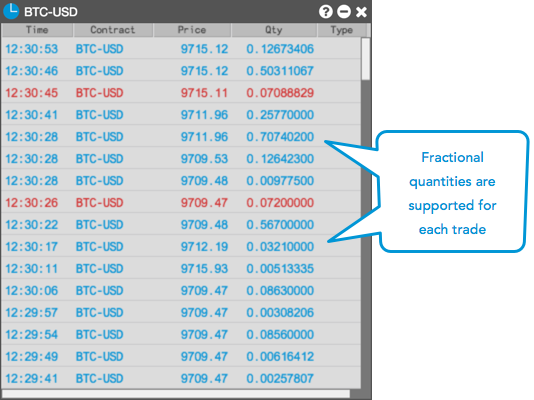
Crypto market data in Time and Sales
For each trade, the Time and Sales widget supports showing the fractional traded order quantity up to eight decimal places.
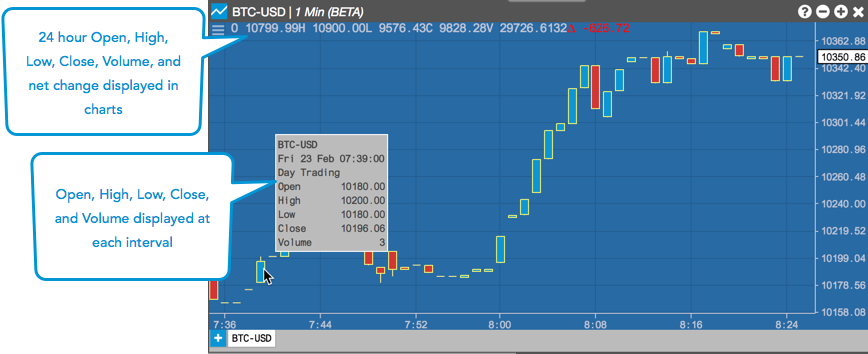
Crypto market data in Charts
For each crypto instrument, the Charts widget supports showing the 24 hour High, Low, Close, Volume, and Net Change in addition to showing market data at each user-defined time interval.