Using DataLens to View Trade Data
Using DataLens to View Trade Data
TT Trade Surveillance DataLens allows you to interact with your data directly using filter, search, and query functions. You can select a specific date and review all corresponding transactions. This provides a streamlined method to locate specific transactions and facilitates rapid investigations.
The DataLens tab is available from the Trade Surveillance menu bar.

Viewing Data
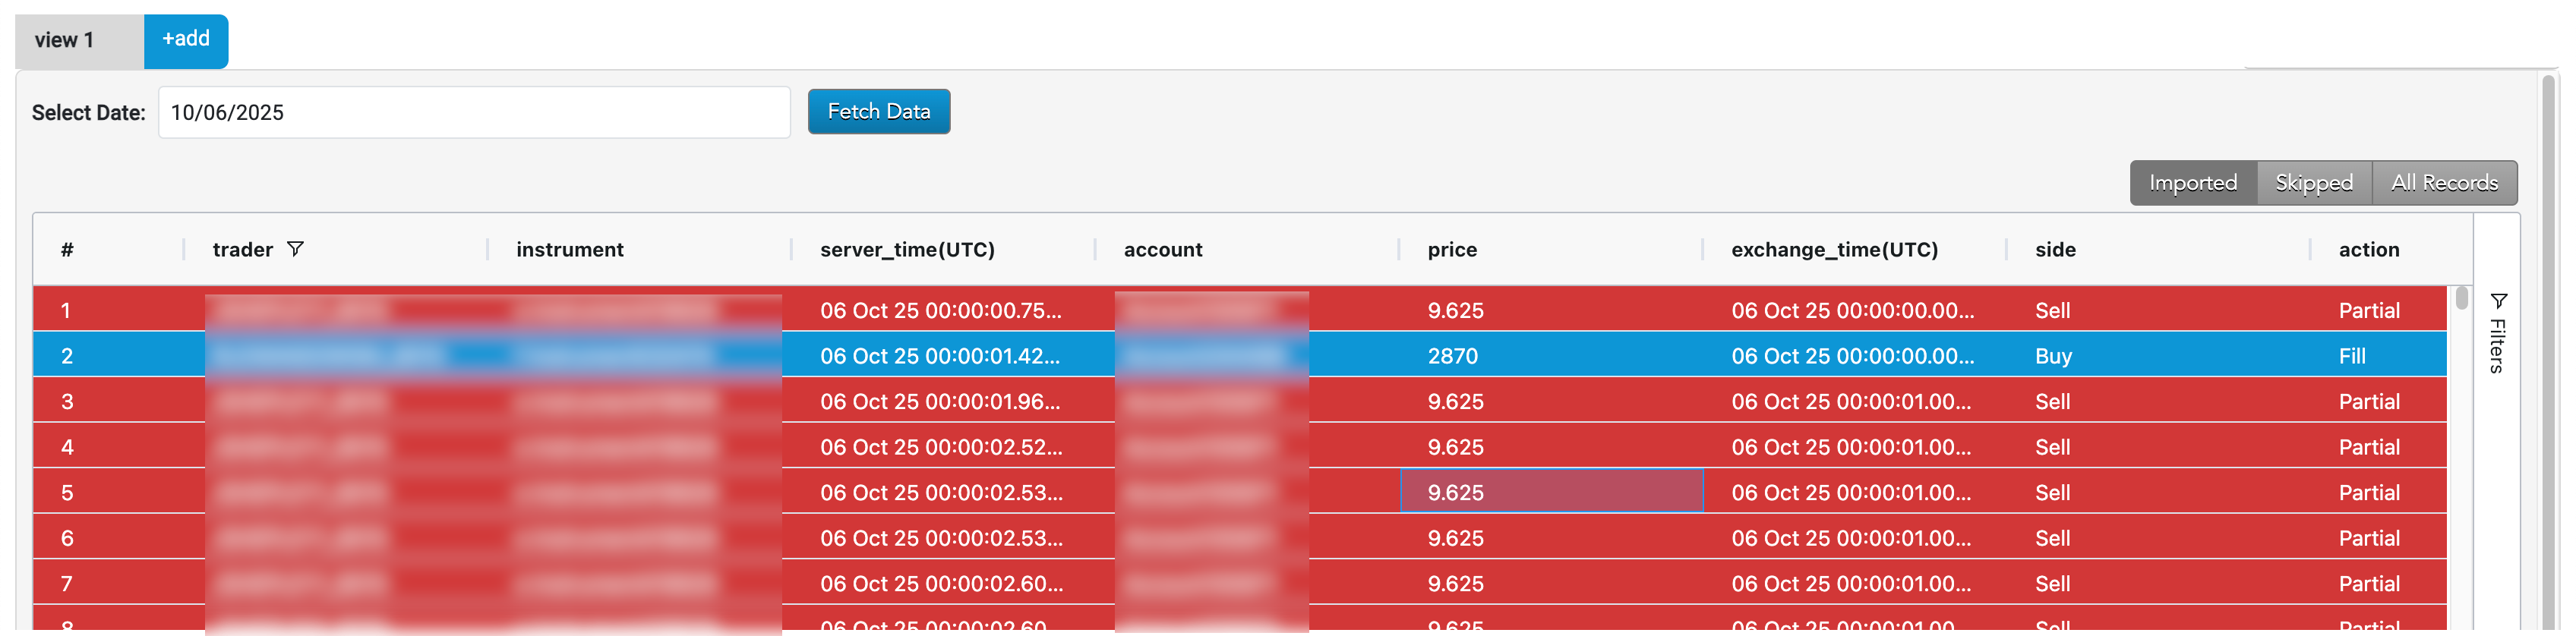
To view data:
- Select a date. The default is the current date.

- Select Fetch Data.
The transactions for that date are displayed. As you scroll down, more rows will load if they are available.
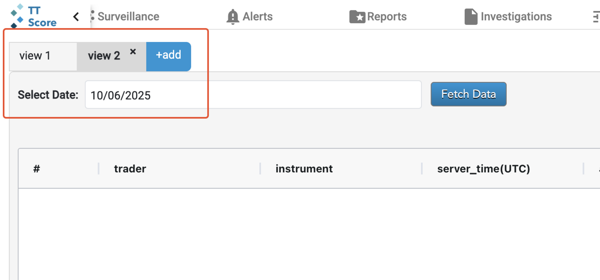
Viewing Data for Multiple Dates
Each tab displays data for one date. You can open multiple tabs simultaneously to display data for different dates by selecting the +add button in the upper-left corner of the screen. This opens a new tab where you can select a new date to view.
Note Switching between tabs does not reset the applied filters.
Filtering Data by Column
You can refine the data visible in the table by applying multiple column-level filters (e.g., trader, instrument, account, price, etc.) simultaneously.
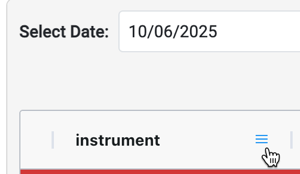
To apply column-level filters:
- Hover over the area to the right of the column header name, select the menu (
 ) button, then select the filter tab.
OR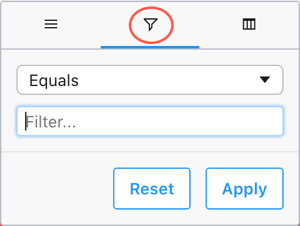
Select the Filters side menu and expand the column(s) to be filtered.
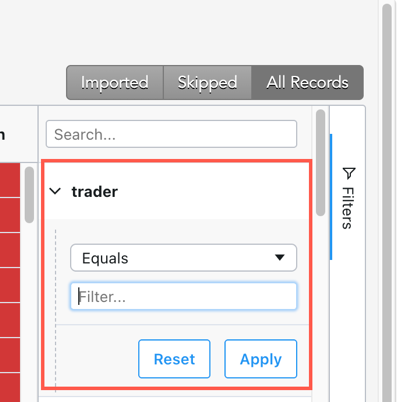
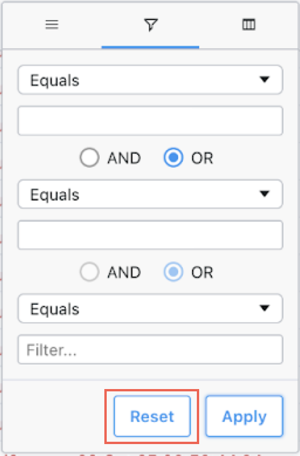
- Select the desired filter operator(s) and enter your search terms.
Note The selected filter type determines which operators are available in the drop-down
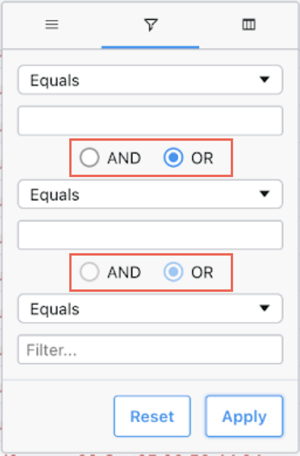
You can apply multiple filters to the same column using AND or OR logic.
- Select Apply.
The filtered results display.
When a filter is applied, a filter ( ) icon will appear beside the column name.
You can filter multiple columns for a view simultaneously. Repeat the steps above to add additional filters.
Column Filter Operators
DataLens provides multiple types of filters. The selected column filter determines which operators are available in the drop-down.
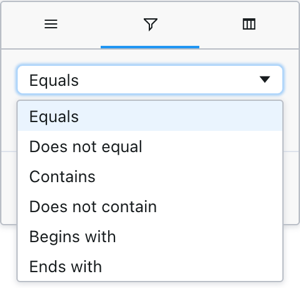
Text-Based Field Operators
For text-based fields such as account or instrument, DataLens supports the following operators:
- Equals
- Does not equal
- Contains
- Does not contain
- Begins with
- Ends with

Numerical Field Operators
For numerical fields such as price or qty, DataLens supports the following operators:
- Equals
- Does not equal
- Less than
- Greater than
- Less than or equal to
- Greater than or equal to
- Between
Resetting Column-Level Filters
To reset all filters and the search terms: select the Reset button. The column will display the full, unfiltered dataset.
Adding and Removing Columns
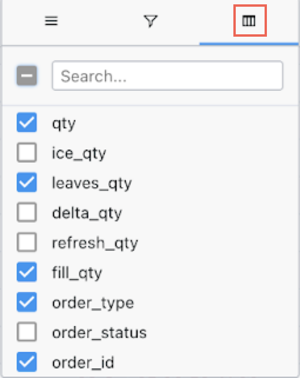
Similar to other audit trail views, you can add or remove visible columns.
To add or remove columns, hover over the area to the right of any column header and select the columns ( ) button. The columns are added or removed immediately.
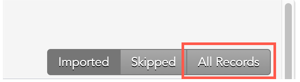
Viewing Imported or Skipped Data
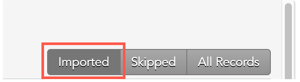
Data that was received and processed by TT is displayed in 3 different views:
- Imported
- Skipped
- All Records
The Imported view is the default and displays all of the records that were successfully processed by TT.

The Skipped view displays all of the transactions that were skipped.
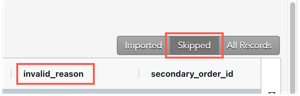
Skipped records appear in grey and contain an “invalid_reason” column which provides the reason the record was skipped.
The All Records view displays all imported records as well as skipped records.
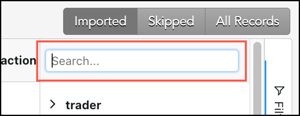
Searching Data
You can search by entering terms in the search bar on the right side of the columns.