Generating a Summary Statistics Report
Generating a Summary Statistics Report
The summary stats report contains statistics for your entire company, as well as statistical data sorted by surveillance model per trader, account, or instrument.
To generate a Summary Stats report:
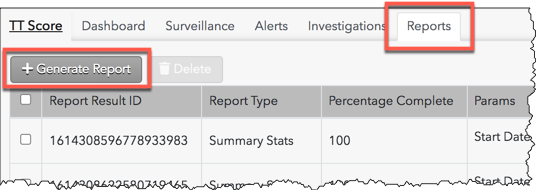
- On the Trade Surveillance dashboard, select the Reports tab and click Generate Report.

The reports data selection panel is displayed on the left side of the screen.
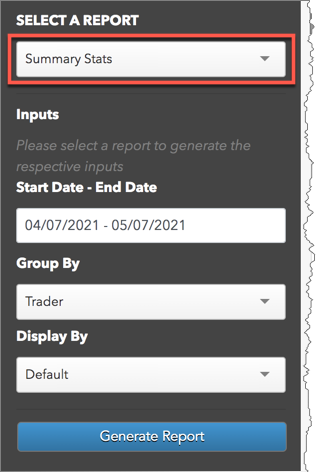
- Select Summary Stats in the Select a Report field in the reports data selection panel.

- Enter data for the following Inputs fields in the panel:
- Start Date - End Date — Sets the time period for reporting the statistics.
- Group By — Allows you to filter the report by "trader", "account", or "instrument".
- Display By — Sorts and displays statistics by surveillance model.
- Click Generate Report.
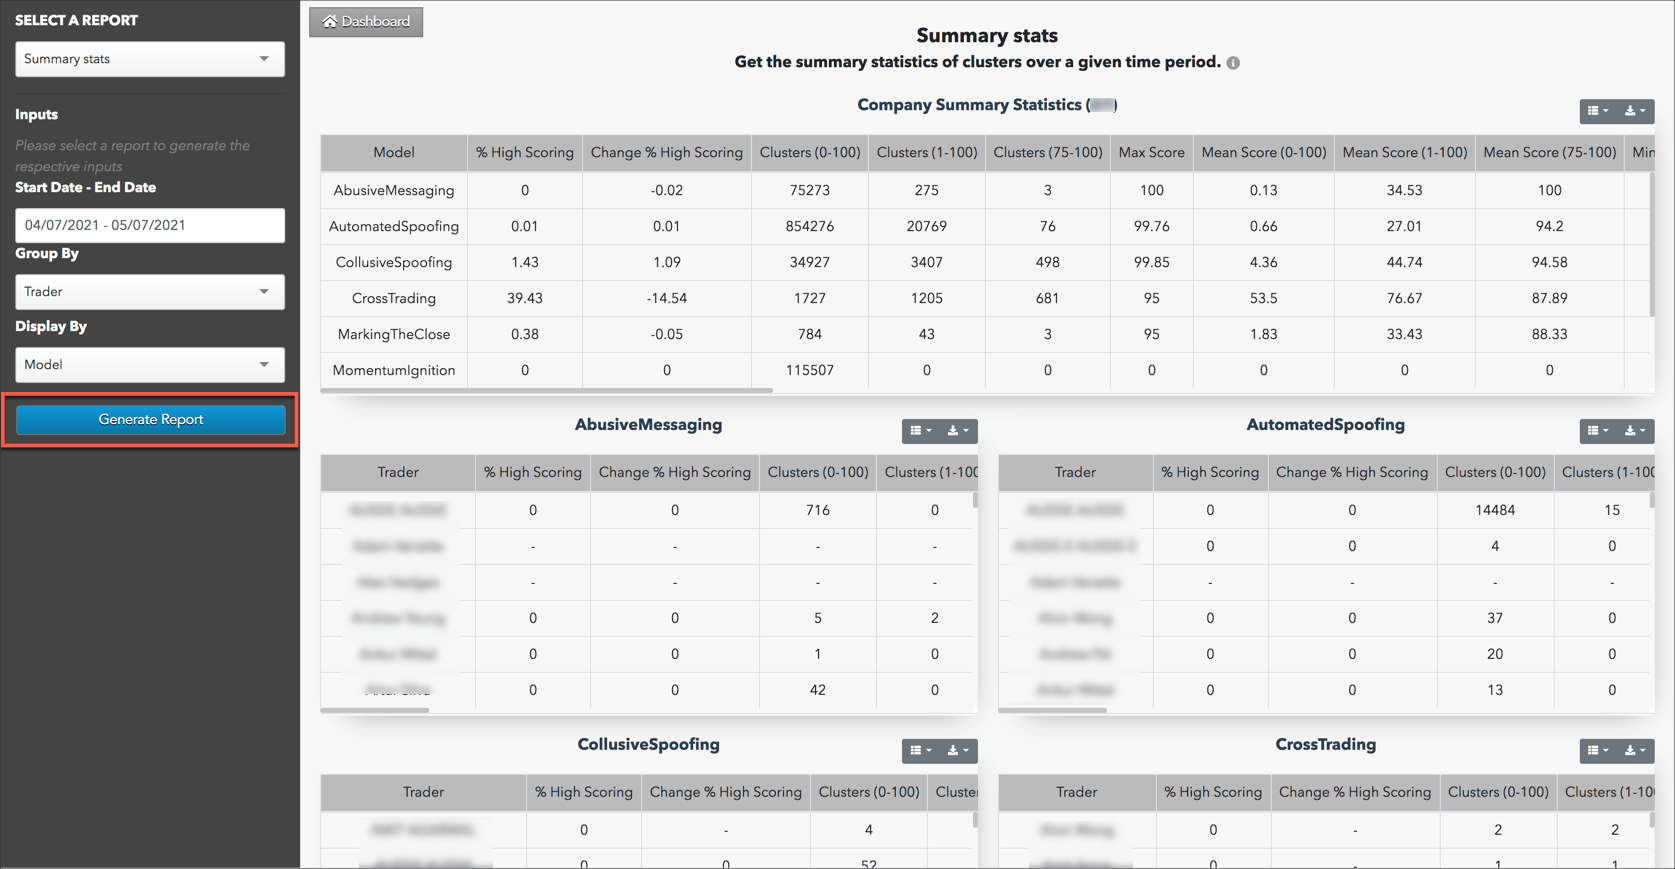
The report is displayed on the screen.

Each section of the report contains statistics in the following columns:
- Model — Name of the surveillance model. This column is displayed for company level statistics, which can be viewed only by Trade Surveillance administrators.
- Trader/Account/Instrument — The name of the trader/account/instrument. This column is displayed per surveillance model based on your "Group By" data selection.
- % High Scoring — The percentage of clusters with a score of 75 - 100.
- Change % High Scoring — Shows the percentage change in high scores since the last time period (Start Date - End Date) the report was generated. Periods must be of the same duration in order to calculate this change.
- Clusters (0-100) — Total number of clusters scored by the model.
- Clusters (1-100) — Total number of clusters receiving a score.
- Clusters (75-100) — Total number of clusters receiving a high score.
- Max Score — The highest cluster score.
- Mean Score (0-100) — The mean of all clusters scored by the model.
- Mean Score (1-100) — The mean of all clusters with a score greater than "0".
- Mean Score (75-100) — The mean of all clusters with a high score.
- Min Score (0-100) — The lowest score of the clusters.
- Min Score (1-100) — The lowest score of the clusters with a score greater than "0".
- Min Score (75-100) — The lowest score of the clusters that received high scores.
- Prev Period % High Scoring — The percentage change of clusters with a score of 75 - 100 from the previous period.
- Prev Period Clusters (0-100) — The total number of clusters scored by the model in the previous period.
- Prev Period Clusters (1-100) — Total number of clusters receiving a score in the previous period.
- Prev Period Clusters (75-100) — Total number of clusters receiving a high score in the previous period.
- Prev Period Max Score — The highest cluster score in the previous period.
- Prev Period Mean Score (0-100) — The mean of all clusters scored by the model in the previous period.
- Prev Period Mean Score (1-100) — The mean of all clusters with a score greater than "0" in the previous period.
- Prev Period Mean Score (75-100) — The mean of all clusters with a high score in the previous period.
- Prev Period Min Score (0-100) — The lowest score of the clusters in the previous period.
- Prev Period Min Score (1-100) — The lowest score of the clusters with a score greater than "0" in the previous period.
- Prev Period Min Score (75-100) — The lowest score of the clusters that received high scores in the previous period.