How TT Trade Surveillance Works
How TT Trade Surveillance Works
TT Trade Surveillance analyzes daily audit log data to identify patterns of activity similar to confirmed examples of problematic trading activity. Each of these patterns is referred to a model. From these models, TT Trade Surveillance generates a variety of metrics that help highlight potential areas of concern.
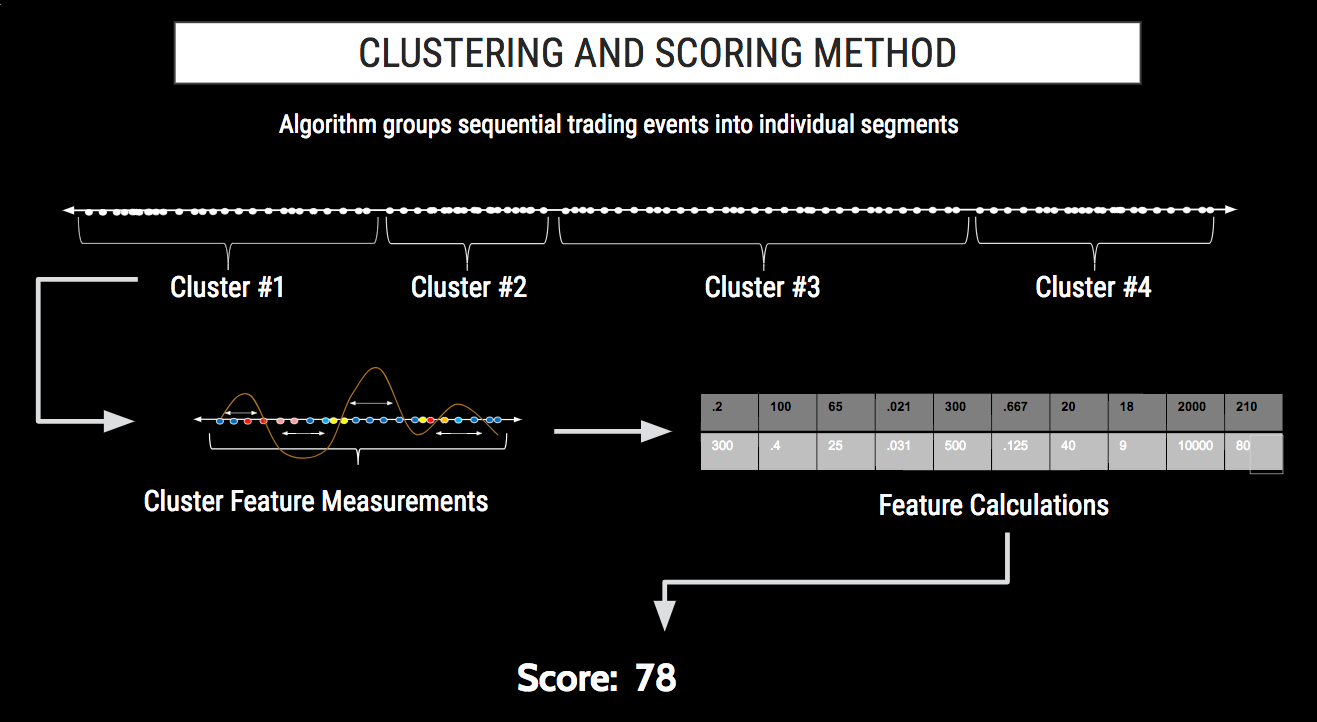
- For each model, TT Trade Surveillance groups all audit log data into "clusters" of sequential trading events likely related to a specific action or series of actions by the trader.
- For problematic trading patterns investigated using a machine learning algorithm, each cluster is analyzed for a number of characteristics, or "features." Based on their similarity to trading patterns from known regulatory cases, the algorithm generates a single risk score.
- For problematic trading patterns investigated using parameter threshold-based methods, each cluster is analyzed for specific metrics and is assigned a numeric score. Based on the type of metric, the score can indicate whether the cluster of activity passed or failed the metric or how far away from a metric's acceptable parameters the cluster activity deviates.
What is a cluster?
A cluster is a sequential series of logged activity from a trader's audit trail. These clusters are segmented based upon factors such as time, trader, financial instrument and proximity of other order actions. They can vary in length from a fraction of a second to a few minutes long and contain every recorded action by a trader.
Cluster analysis - Machine Learning

For problematic trading patterns investigated using machine learning, the machine learning algorithm analyzes each cluster and extracts characteristics called “features,” such as the number of canceled orders or the ratio of one action to another. The algorithm builds a collection of over 30 different features and then compares this combination of features to known problematic trading patterns, such as spoofing.
The various comparisons of a cluster's features to the characteristics of known problematic trading patterns are given a numeric score. These scores are weighted, based on the likelihood that the score indicates problematic activity. The aggregation of these individual weighted scores are used to generate a single risk score on a 0 to 100 scale for every cluster.
Cluster analysis - Parameter Thresholds
For problematic trading patterns investigated using parameter thresholds, characteristics of clusters are measured and compared to benchmarks, such as time between orders or the number of canceled orders. For trading patterns where simply exceeding a threshold indicates the possibility of problematic activity, a pass/fail score is assigned to the cluster as either 0 or 100. Where the degree to which a cluster exceeds a threshold must be evaluated, a score between 0 and 100 is generated to indicate how far beyond a threshold the cluster was measured.