Trading Behaviors Models
Dominance at Open
Dominance at Open occurs when a single trader's fills make up the majority of the market volume of an instrument during the initial 15 minutes of the market session. The Dominance at Open model in TT Trade Surveillance analyzes and scores clusters that may indicate that a single trader is dominating the total traded volume for an instrument during the market open.
When a single trader's resting orders make up the majority of the fill volume for an instrument, they have control over the pricing of that instrument. The Dominance at Open model can alert your firm to this behavior, which may be an indication of potential market manipulation.
Note: The Dominance at Open model only identifies potentially suspicious trading behavior. This model does not necessarily reflect an actual rule violation.
Scoring methodology
Scores are based on the percent of trader volume compared to the total market volume and a measure of how aggressive that trading was.
Dominance at Open score interpretation
Each cluster is assigned a risk score on a sliding scale between 0-100. This score represents the probability that Dominance at Open occurred during the duration of the cluster's trading activity.
Based on TT Trade Surveillance best practices, clusters that score over 75 are deemed to be “high risk” and should be the primary focus of users during their compliance reviews.
Dominance at Open scorecard metrics
The Scorecard Metrics section measures the following statistics related to market open dominance:
- Vol At Open (15 min) — Total traded volume in the first 15 minutes of the session.
- Trader Buy Fill Vol — The trader's total volume of buy side fills for the current trading session.
- Trader Sell Fill Vol — The trader's total volume of sell side fills for the current trading session.
- Trader Fill Vol At Open — The trader's total volume of both buy and sell side fills for the first 15 minutes of the session.
- Trader Vs Session At Open — The ratio of the trader's fill quantity and the total fill quantity for an instrument in the first 15 minutes of the session.
- Trader Buy Vs Total Fill Vol — The ratio of the trader's total volume of buy side fills and the total fill volume for the trading session.
- Trader Sell Vs Total Fill Vol — The ratio of the trader's total volume of sell side fills and the total fill volume for the trading session.
- LTP Session — The instrument's last traded price for the current session.
- OpenPrice Session — The instrument's opening price at the start of the current session.
- Closeprice Previous Session — The instrument's closing price at the end of the previous session.
- Aggressor Ratio — THe ratio of aggressive to passive orders. This is a key metric in determining the overall cluster's score.
- Session StartTime — The start time for the trading session.
- Session EndTime — The end time for the trading session.
Identifying Dominance at Open
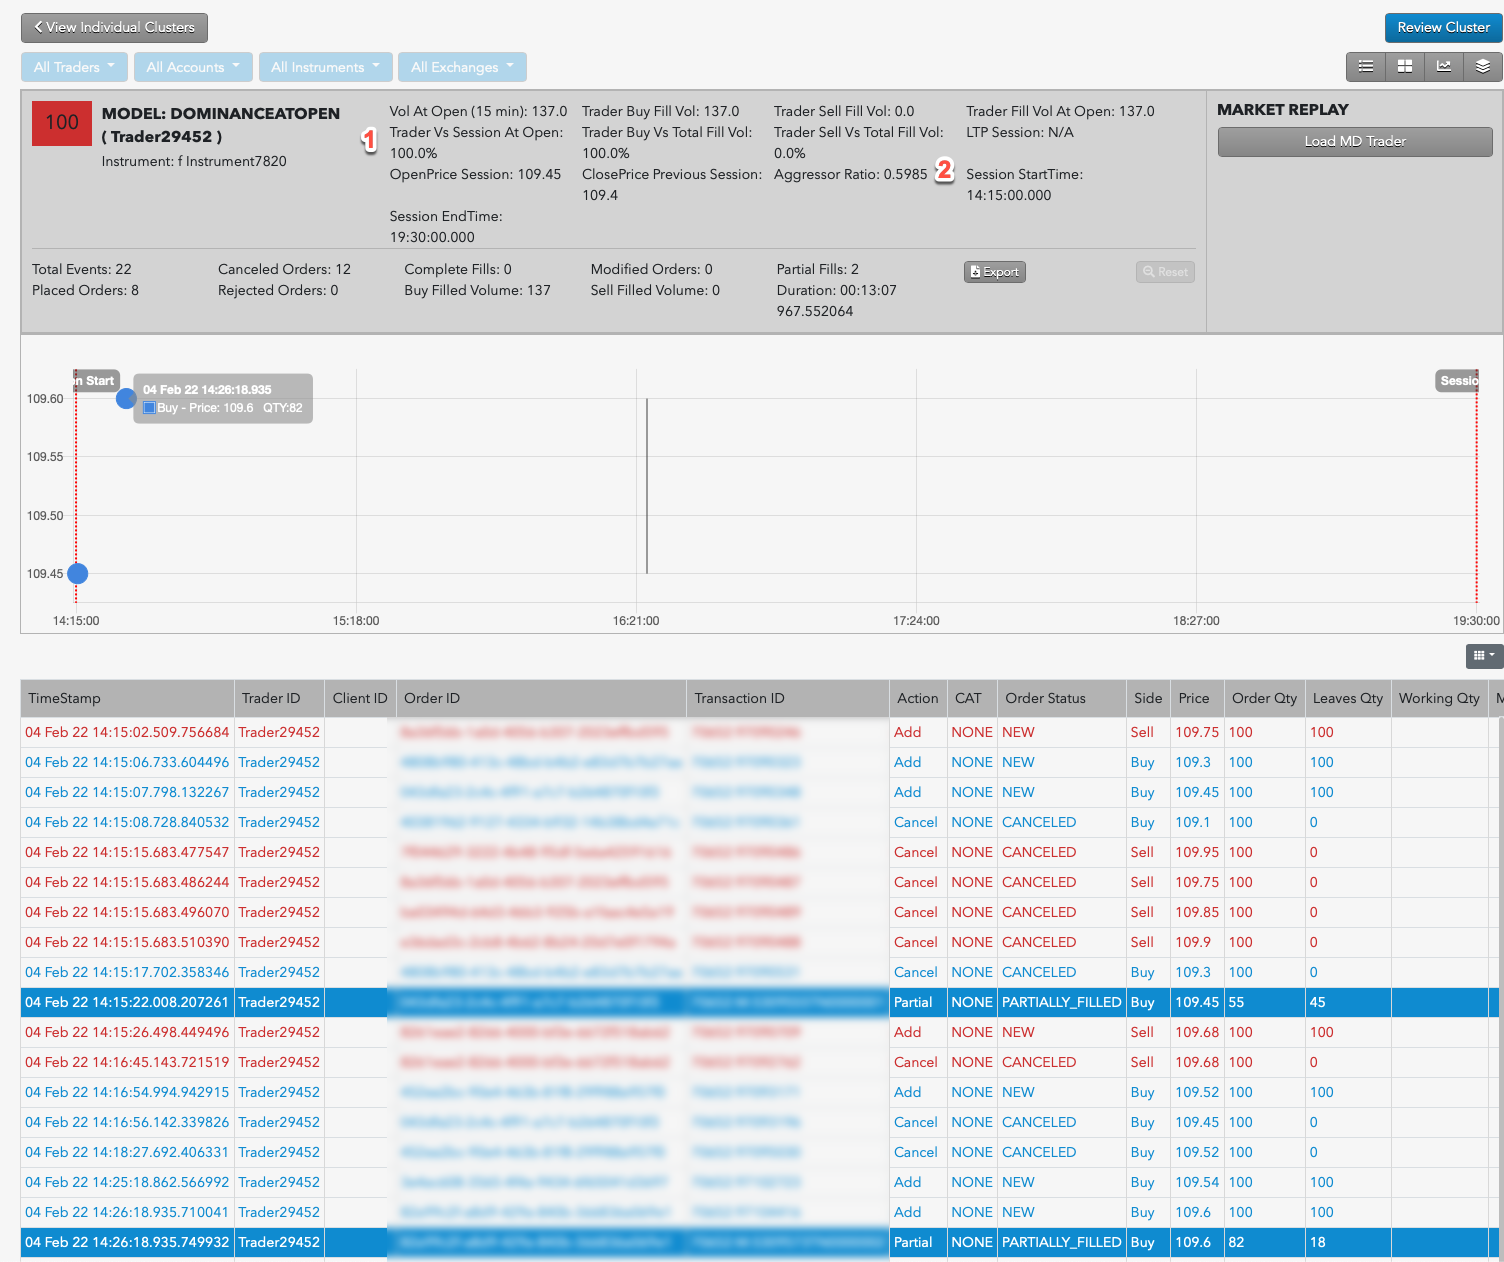
Using the Cluster Scorecard, you can view the details of the activity that triggered the market open dominance score.

For example:
- The Trader Vs Session at Open shows the trader submitted a high percentage of the session orders during the first 15 minutes of trading.
- The Aggressor Ratio reflects a high ratio (more that 50%) between aggressive and passive orders.
The Trader Vs Session at Open shows the trader submitted a high percentage of the session orders during the first 15 minutes of trading.