Market Rate Models
Abusive Messaging
Abusive messaging involves patterns of disruptive or excessive order activity that can harm markets.
- Quote stuffing: Quote stuffing is an attempt to disrupt normal market operations by introducing latency into an exchange's quoting engine to prevent other traders from trading as intended. A trader intentionally places orders at a pace that will slow market updates.
- Microburst quote stuffing: This form of quote stuffing involves submitting extremely high rates of messages over very short periods of time, which can introduce predictable latency while avoiding traditional detection methods. For example, submitting 80 messages in a single millisecond can appear as a non-interrupting 80 messages per second, while it actually has an effective rate of 80,000 messages per second.
- Malfunctioning algorithms: Due to the speed at which algorithms can send messages, even minor errors in an algorithm can have major impacts on market behavior.
Scoring methodology
For the abusive messaging pattern, TT Trade Surveillance analyzes clusters for messaging rates, looking for high rates regardless of duration. Risk monitors can then evaluate whether the messaging pattern might be a case of abusive messaging or makes sense in context.
Score interpretation
The score is assigned based on a sliding scale of 0 to 100 with the score increasing as higher message rate bursts are identified.
Based on TT Trade Surveillance best practices, clusters that score over 75 are deemed to be “high risk” and should be the primary focus of users during their compliance reviews.
Scorecard metrics
The Scorecard Metrics section measures the following statistics related to abusive messaging:
- Avg. Msgs/sec
- Low-rate Msgs
- Med-rate Msgs
- High-rate Msgs
Identifying abusive messaging
Use the Cluster Scorecard to get a closer look at the activity that triggered the abusive messaging score. The Cluster Statistics and Scorecard Metrics sections of the scorecard show the:
- Time duration of the cluster
- Total number of messages sent
- Percentages for different message rates
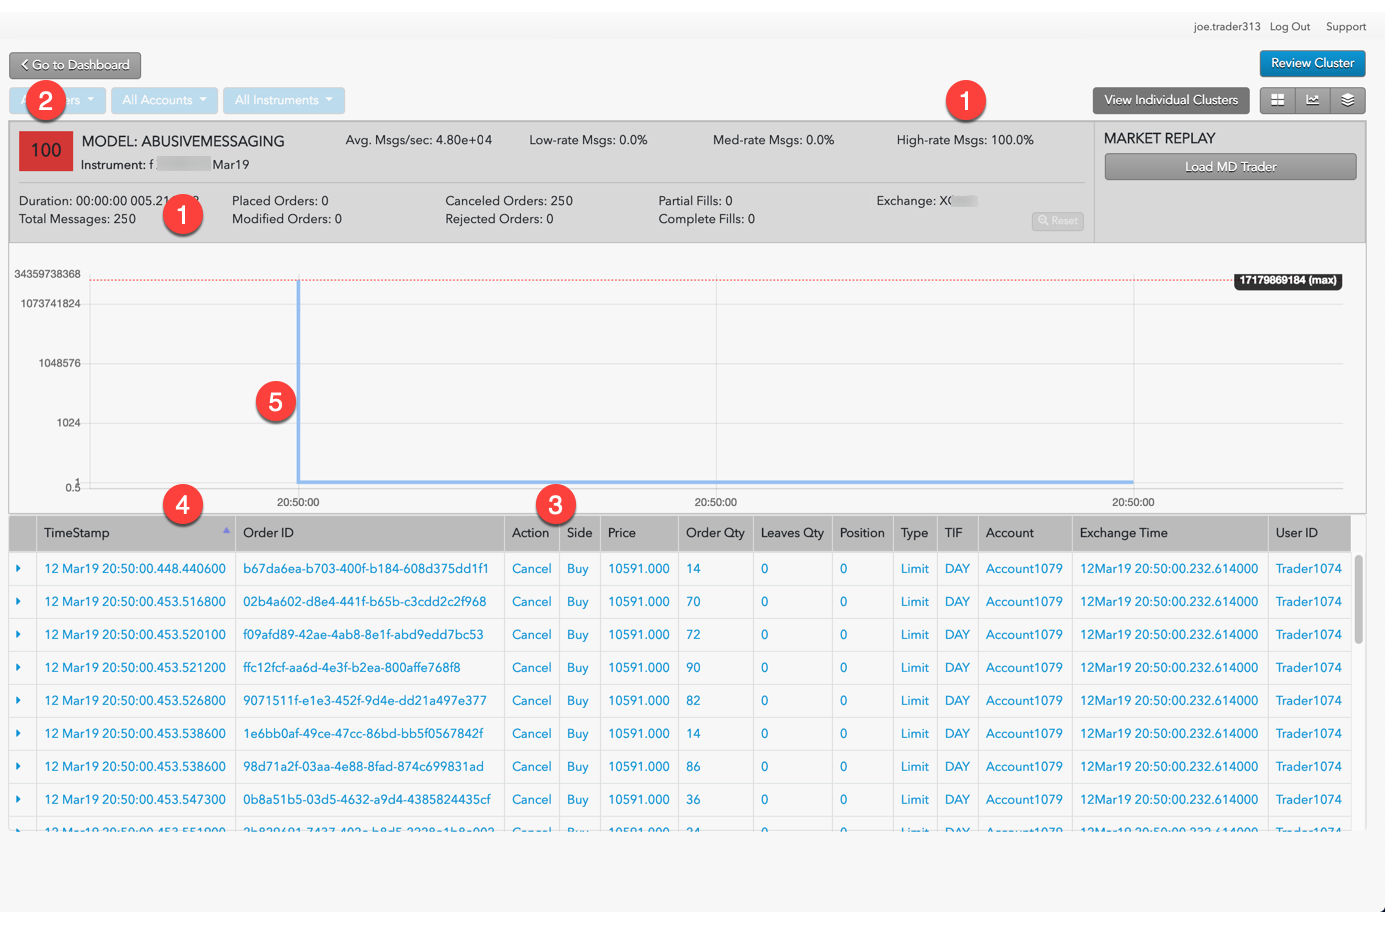
The chart at the bottom of the scorecard can give you visual clues about the abusive messaging pattern. For example, the chart in the following scorecard for a cluster with a high percentage of high-rate messages over a very short time period.

- In just over five-thousandths of a second, the trader canceled 250 order messages, 100% of which were considered to be submitted at a high rate.
- The risk indicator indicates this cluster has a risk score of 100.
- The trader repeatedly submitted the same type of order.
- The exchange times indicated the messages were sent in micro-second intervals.
- The Burst Chart graph shows that for the first six-tenths of a second, the trader submitted messages at a rate of well over 45,000 messages per second.