Market Depth Tool
Market Depth Tool
The Market Depth tool is a visualization in TT Trade Surveillance that displays a market snapshot of the instrument. Trade Surveillance displays the market high-low and the book data for the respective instrument of the cluster and displays it in a visualization that provides a snapshot of how the market is trending around the cluster start and end time. The Market Depth tool also displays the trader activity from the scorecard view and marks the respective activity accordingly.
The Market Depth tool is available in the Cluster Scorecard and it is available for all models across Trade Surveillance, including models that don't have any default graphical representation.
Market Data Sets
The Market Depth visualization mainly consists of three sets of market data:
- Bars Data (Market High-Low)
- Book Data (Market Depth)
- Trader Activity (Buys, Sells, Fills/Partials, Adds and Cancels)
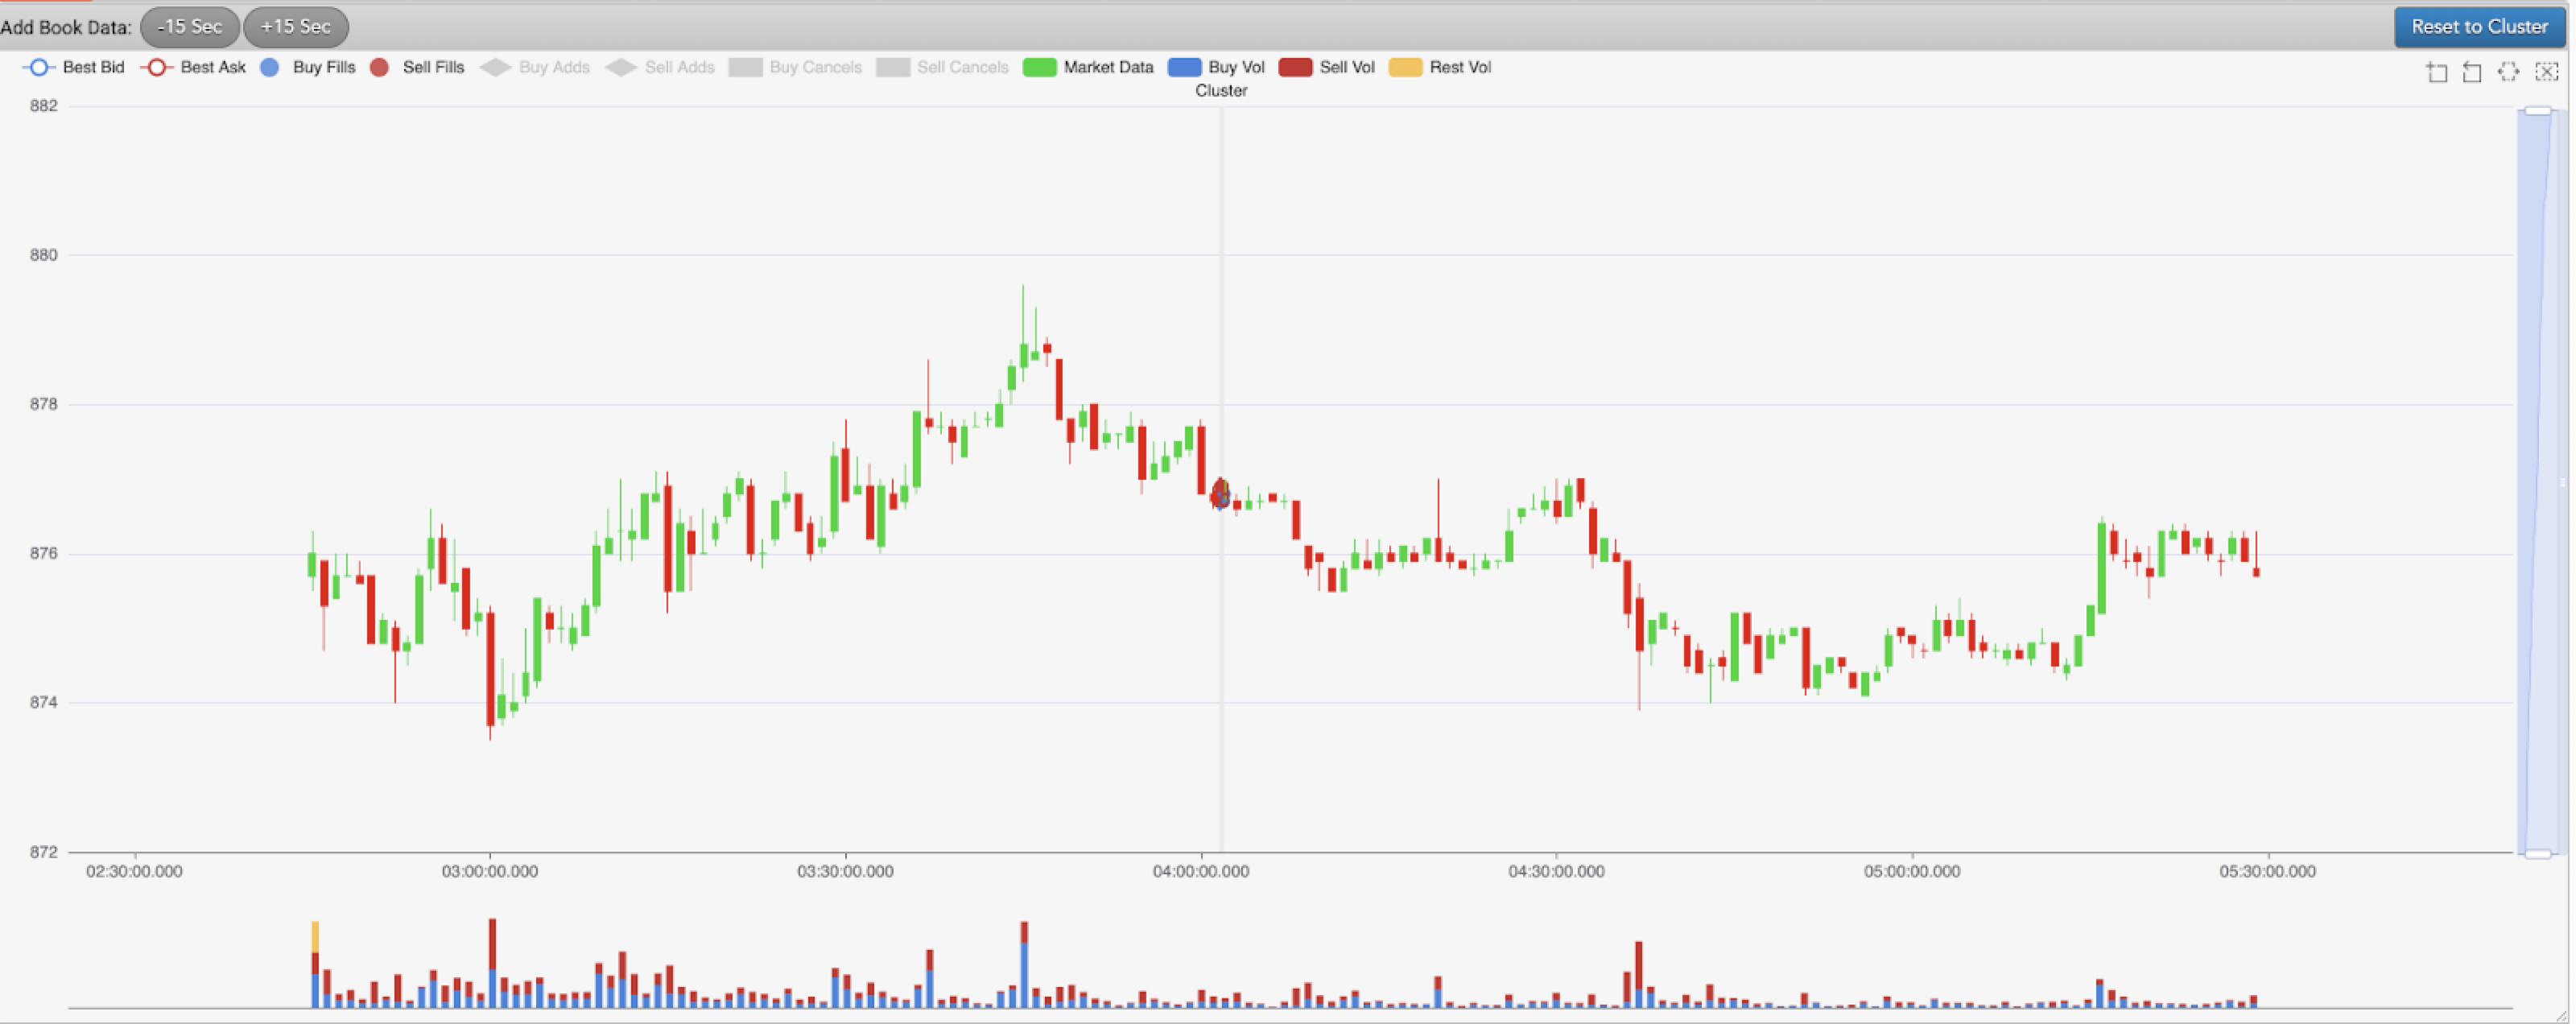
Bars Data
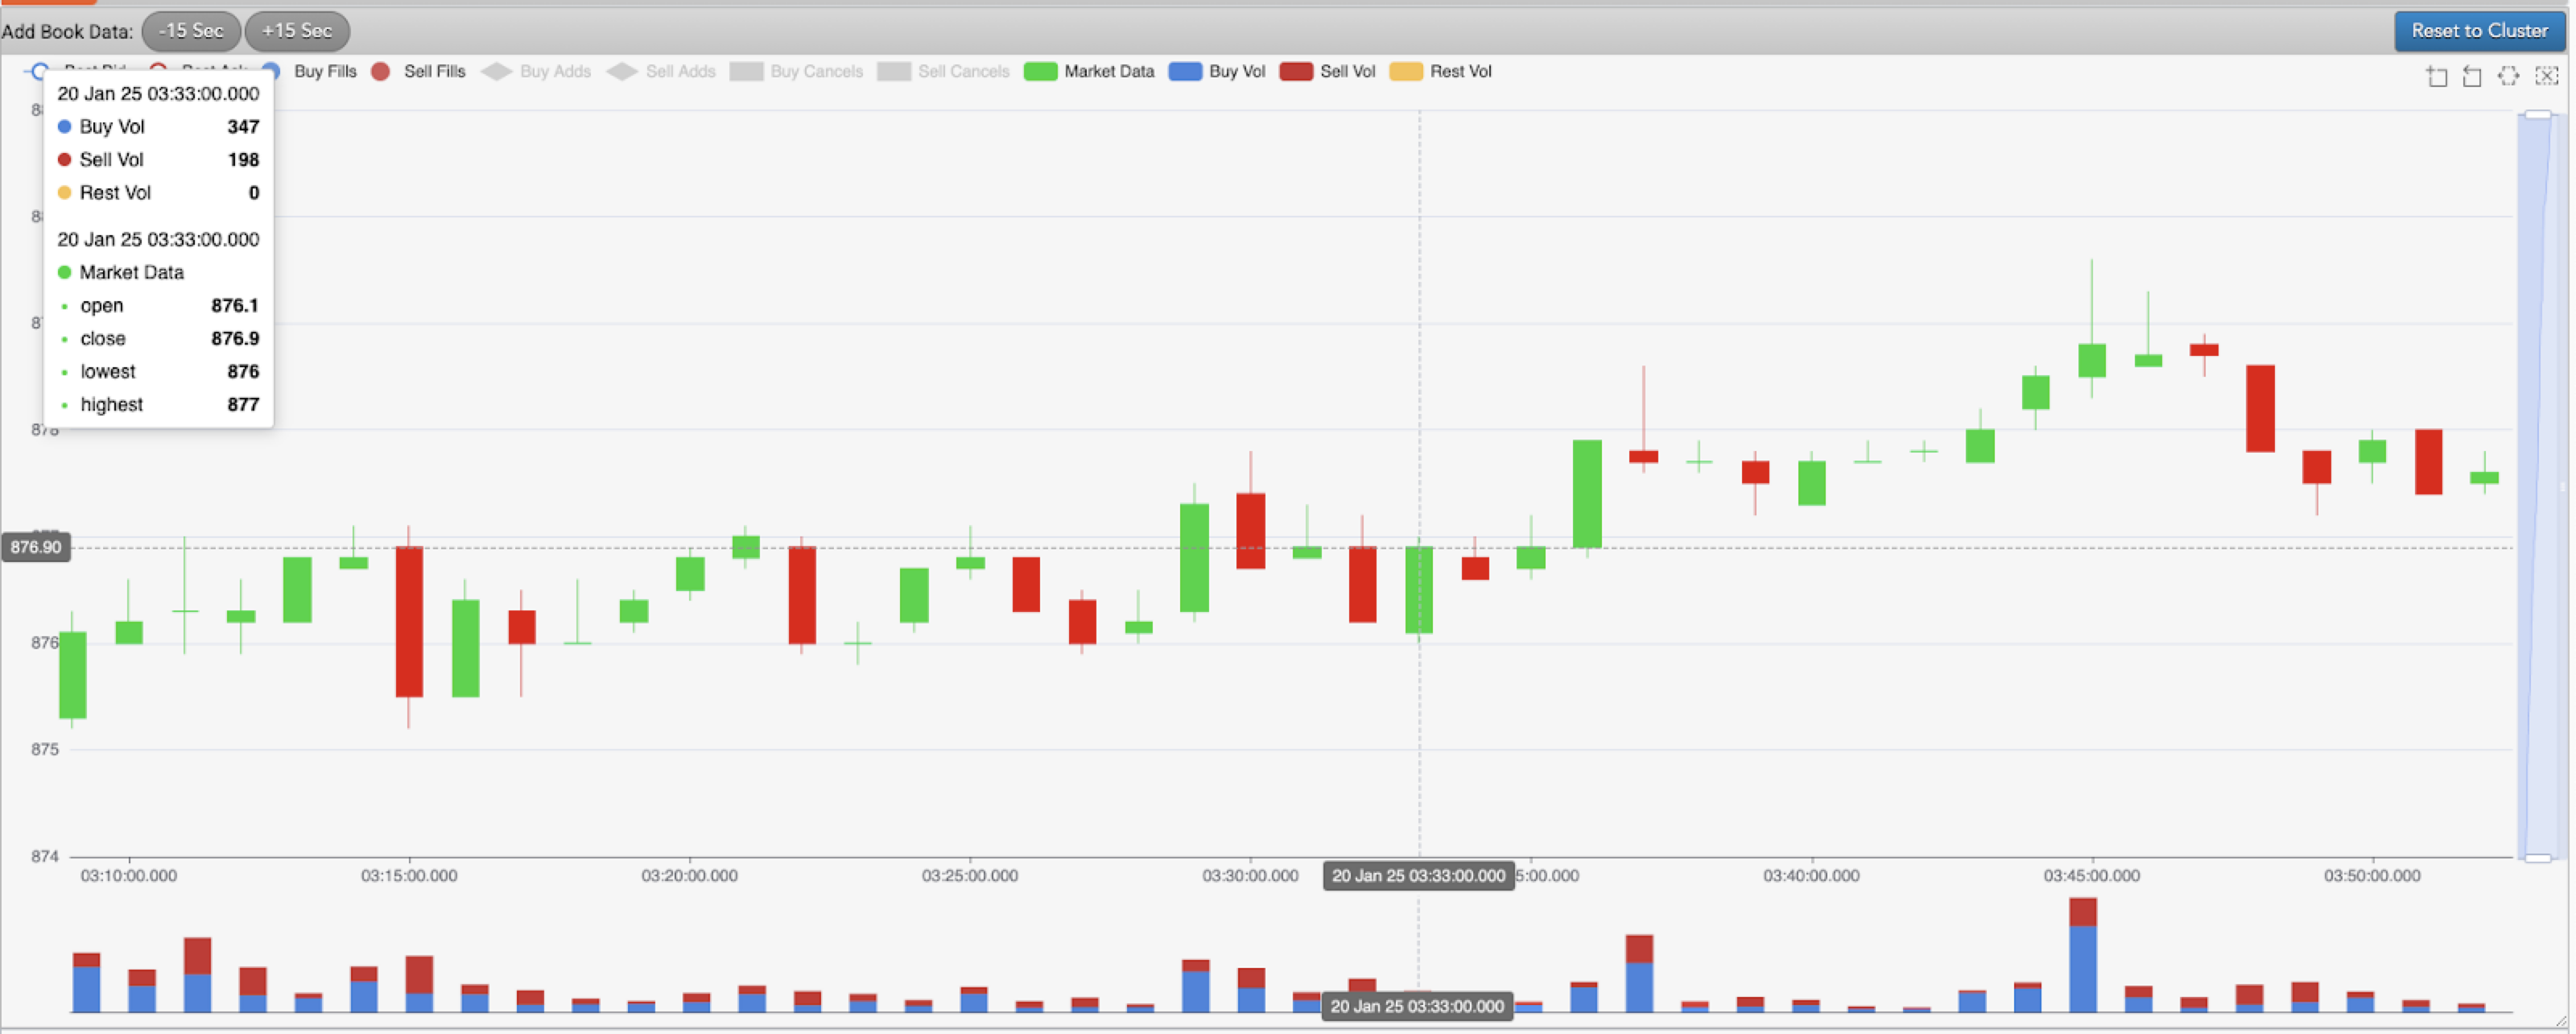
A total of 12 hours of Bars data (6 hours before and 6 hours after the cluster start time) for the cluster's instrument is displayed as a candlestick chart showing the price high-low data at the respective times. This data is usually at one-minute granularity. The volume data is also available at the bottom of the candlestick chart. It displays as a stacked bar chart between three volumes: Buy Volume, Sell Volume and Rest Volume.
The candlestick chart and the bar chart are linked together and can be zoomed and scaled together. Multiple selection tools are available to interact with the chart to zoom and scale the axis to view the data.
Book Data
TOB (Top Of Book) data is provided in millisecond granularity. The data is requested initially from the cluster start time and end time. A highlight is drawn on the chart to show the cluster start and end time in the visualization. The Bars data, if present during this time, is overlaid on the book data. You can zoom in and out of the book data. Two action buttons on the top toolbar can be used to subtract (-15 sec) and add (+15 sec) of book data from/to the existing cluster book data that is loaded. This provides a view of the market TOB data, not only during the cluster times, but also immediately before and after the cluster times.
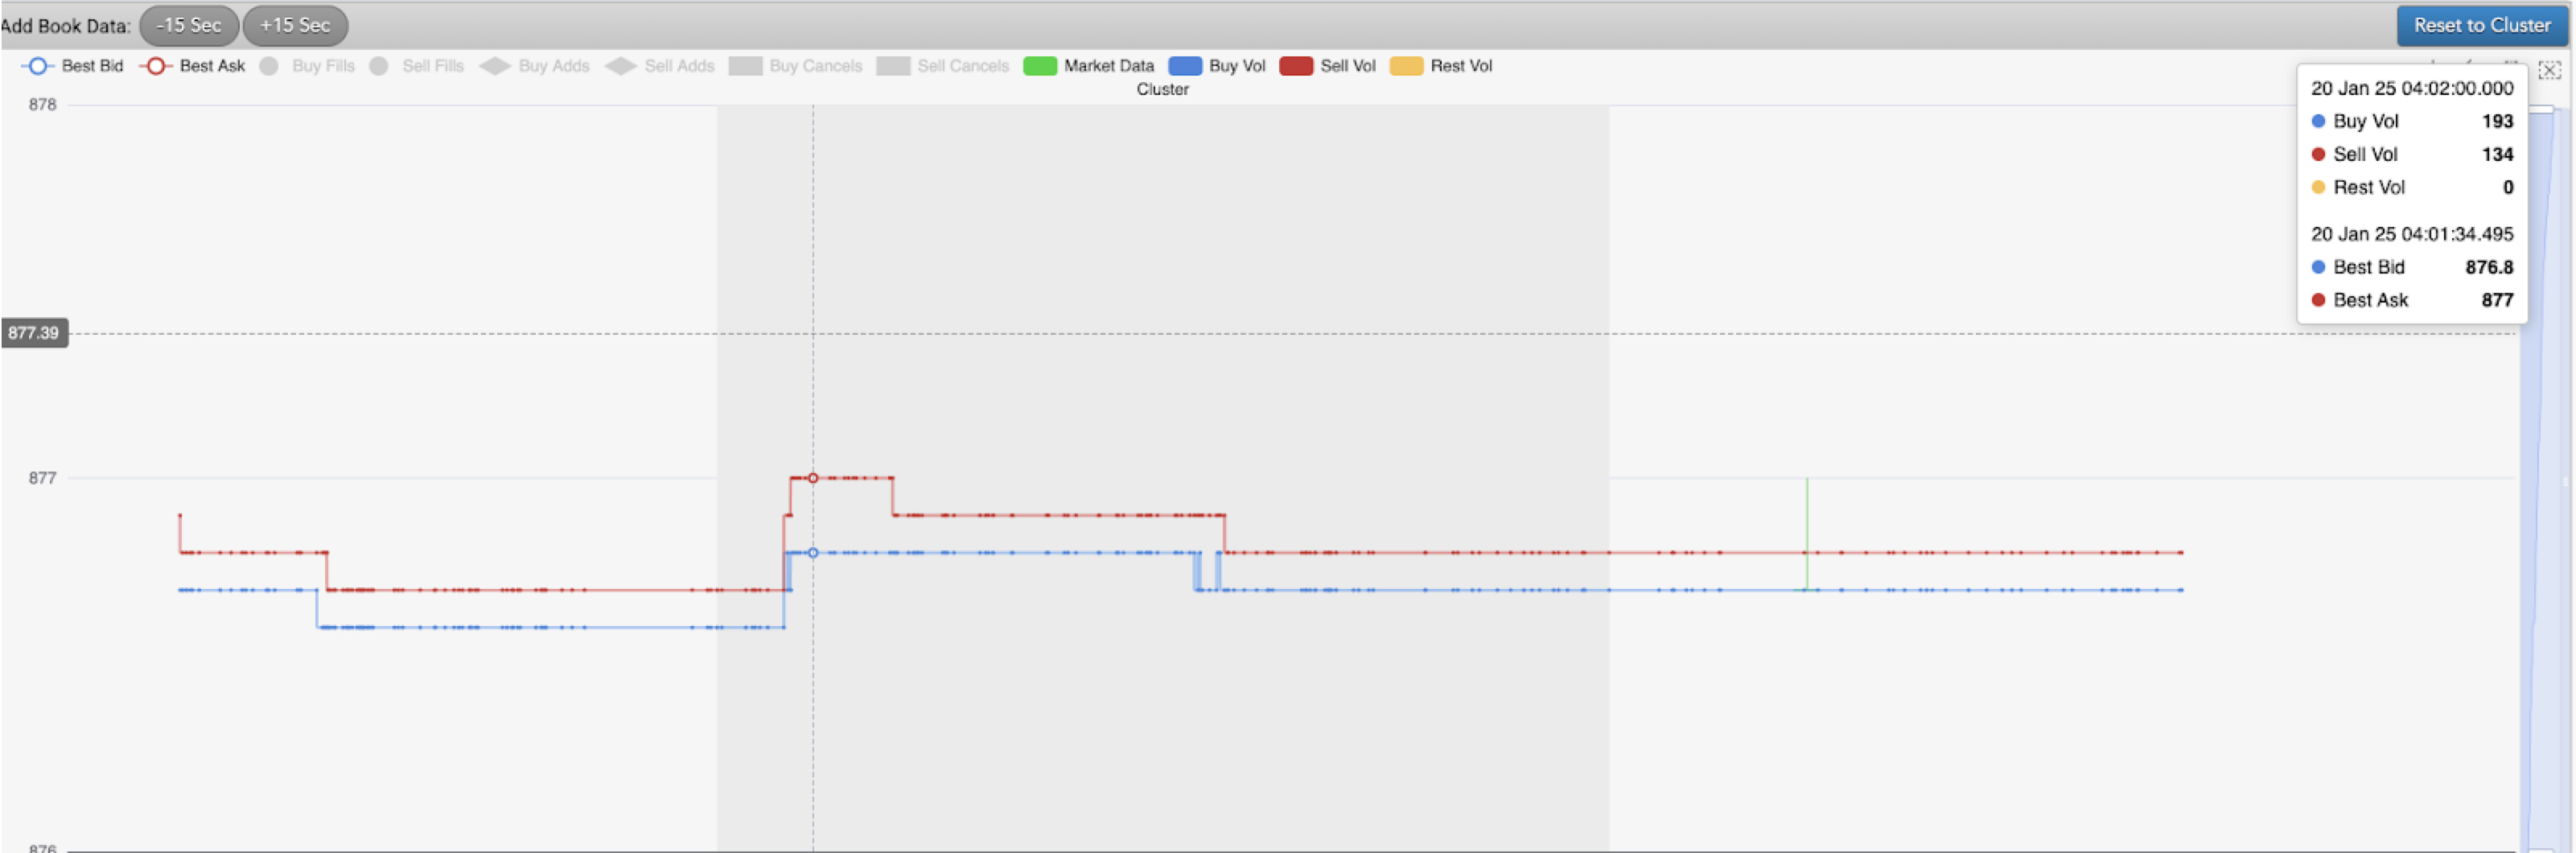
In the above example, the book data drawn within the highlighted area represents the market TOB data and, using the action buttons in the upper right-hand corner, 15 seconds of TOB data are added before and after cluster start times. The Reset to Cluster button on the toolbar quickly takes you to the cluster timestamps if you have zoomed out and lost track of where the cluster is present.
Trader Activity
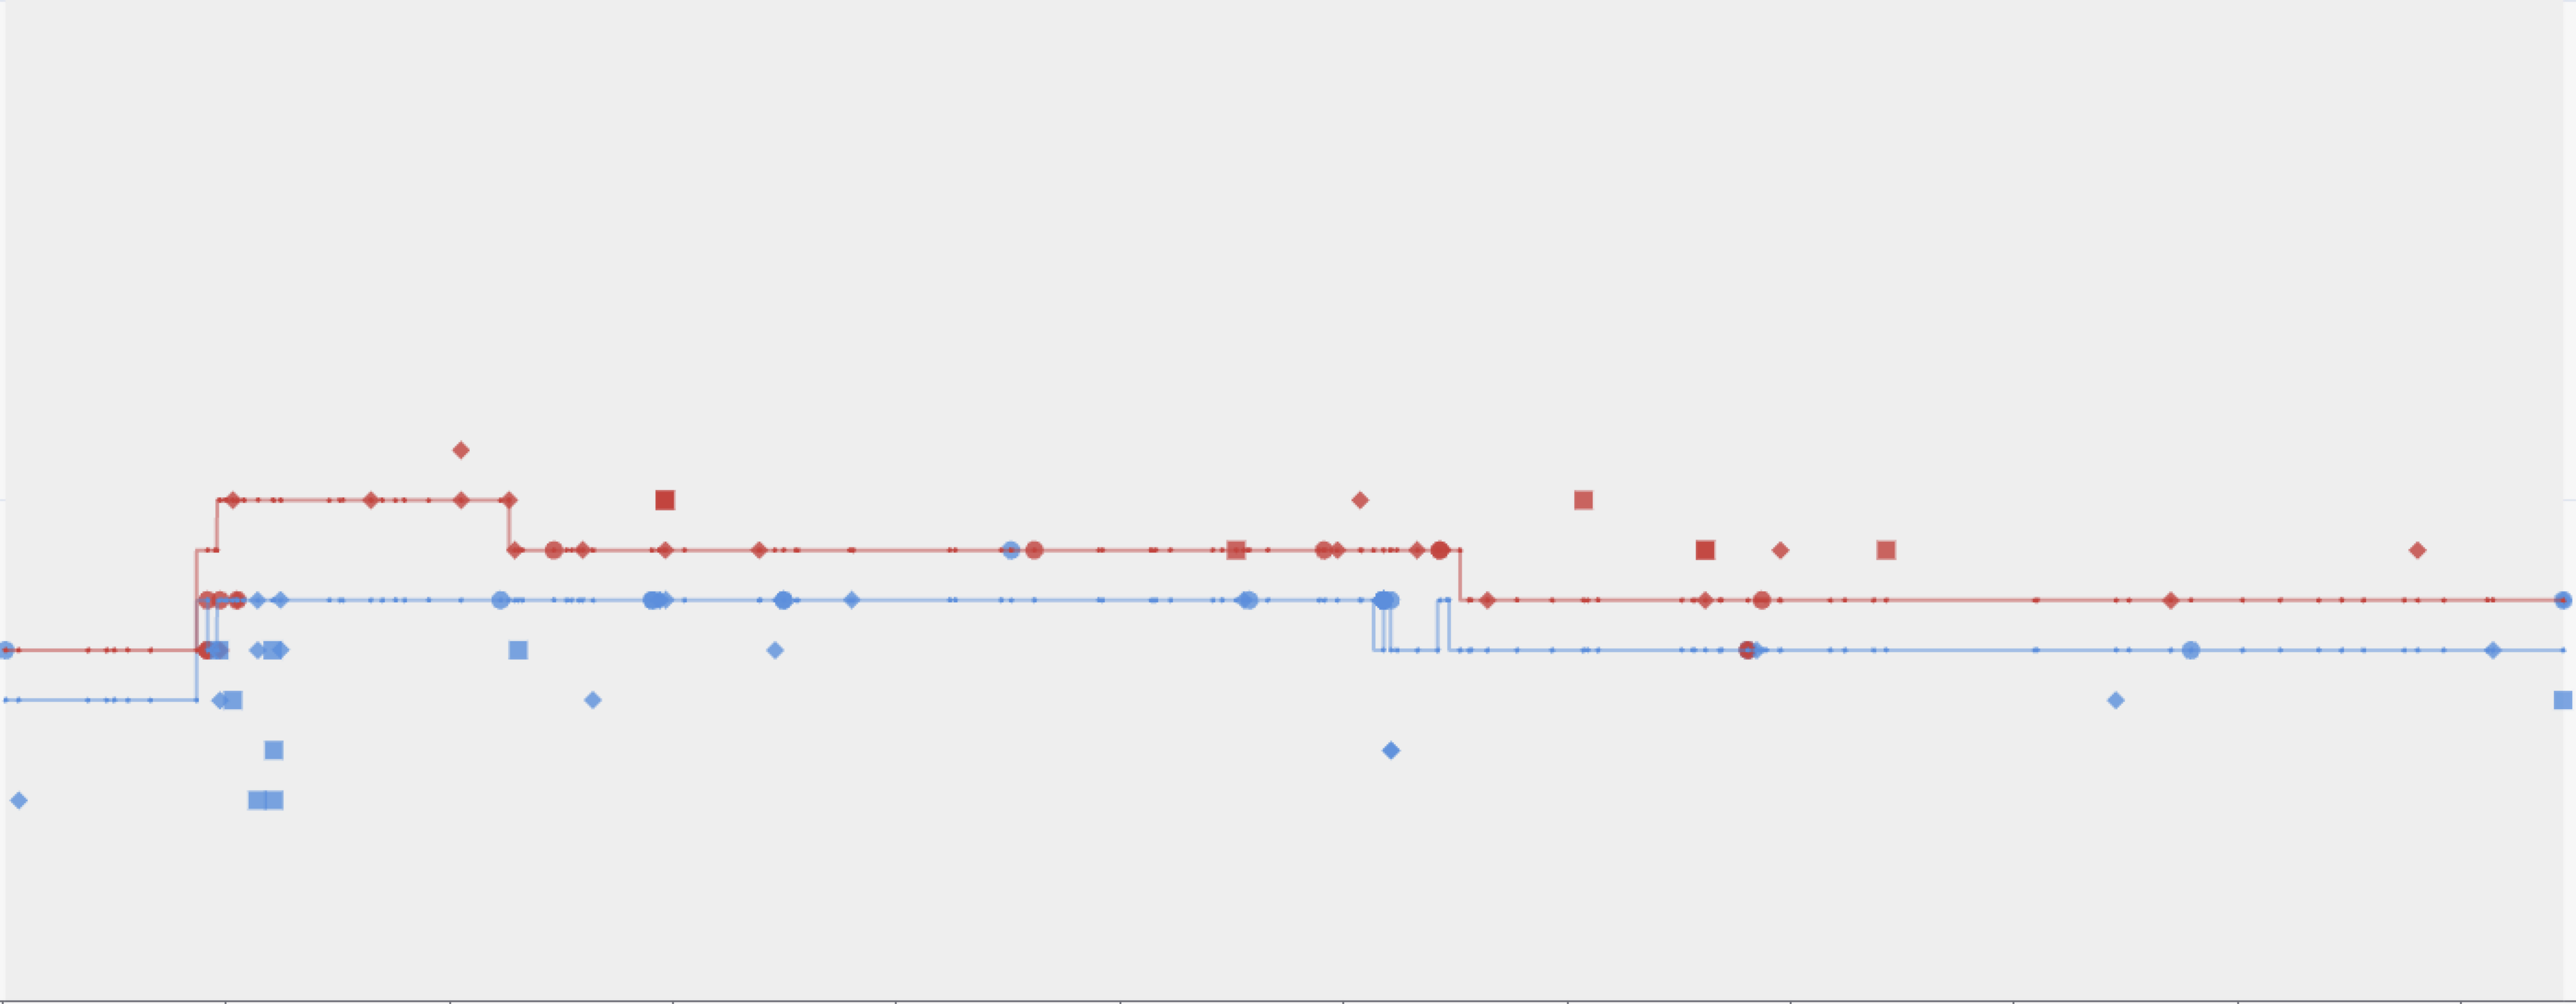
Trader activity (adds, fills, buys, sells and cancels) are mapped to their respective prices and timeframes and can be displayed in this visualization. By default, only the buy fills and sell fills are selected; other activity is not selected. This trader activity will only be available during the cluster start and end times and no data will be present outside this timeframe.
Trader activity is represented by various shapes and colors. Generally, blue represents buys and red represents sells.
- Circles — Fills
- Diamonds — Adds
- Squares — Cancels
This data provides a visualization of where the trader activity was below/above the TOB and how it effects the market price flow.