Charts
Swing Index (SI)
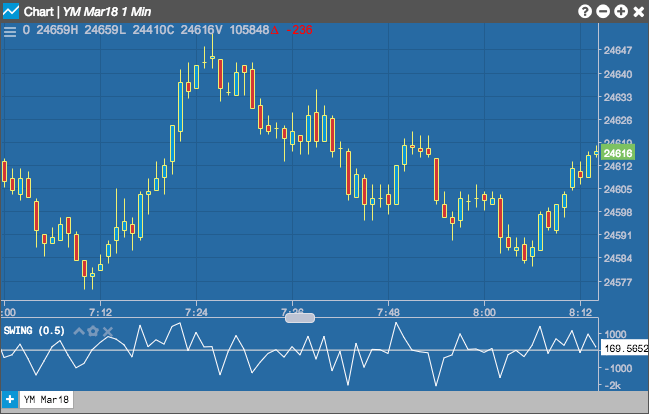
The Swing Index (SI) indicator is an oscillator that is used as part of the Accumulative Swing Index for determining price trends for an instrument. Typically, an indication to buy is when the SI curve crosses above the zero line, and an indication to sell is when the SI curve crosses below the zero line.
Configuration Options
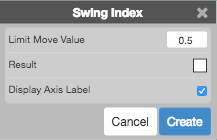
- Limit Move Value: Value of a limit move in one direction
- Color Selectors: Colors to use for graph elements.
- Display Axis Label: Whether to display the most recent value on the Y axis.
Formula
\[ SI = 50 \times \left ( \frac{(C_{y} - C_{t}) + (0.5 * (C_{y} - O_{y}) + (0.25 * (C_{t} - O_{t})}{R} \right ) \times \frac{K}{T} \]
where:
- Oy = Yesterday's Open
- Ot = Today's Open
- Hy = Yesterday's High
- Ht = Today's High
- Ly = Yesterday's Low
- Lt = Today's Low
- Cy = Yesterday's Close
- Ct = Today's Close
- K = largest of:
- Ht - Cy
- Lt - Cy
- R is based on the largest of:
- Ht - Cy
- Lt - Cy
- Ht - Lt
If (2) is the largest, R = (Lt - Cy) - .5(H2 - Cy) + .25(Cy - Oy)
If (3) is the largest, R = (Ht - Lt) + .25(Cy - - T = Limit Move Value