Charts
Supertrend
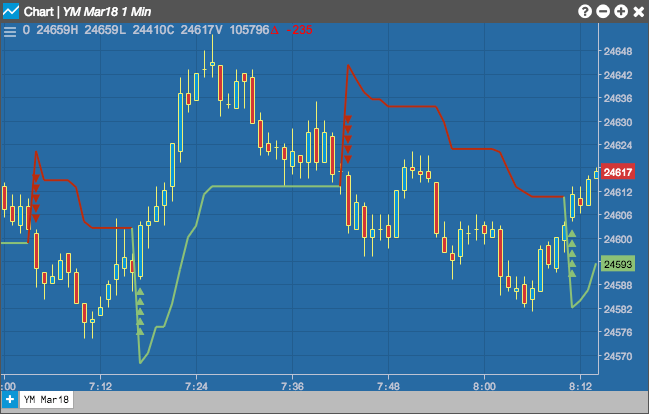
The Supertrend indicator is used for timing when to buy and sell based on changes in the trend indicator. Typically, a buy signal is when the indicator value closes below the closing price for an instrument, and a sell signal is when the indicator closes above the closing price.
Configuration Options
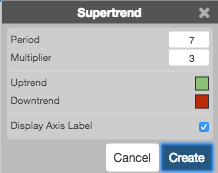
- Period: Number of bars to use in the calculations.
- Mulitplier: Volatility-based mulitplier
- Color Selectors: Colors to use for graph elements.
- Display Axis Label: Whether to display the most recent value on the Y axis.
Formula
\[ Upper = \frac{(high + low)}{2} + (Mulitplier * ATR) \]
\[ Lower = \frac{(high + low)}{2} - (Mulitplier * ATR) \]
Upper = ((high + low / 2) + Multiplier * ATR (Only if price < upper)
Lower = ((high + low / 2) – Multiplier * ATR (Only if price > lower)