Charts
Average True Range (ATR)
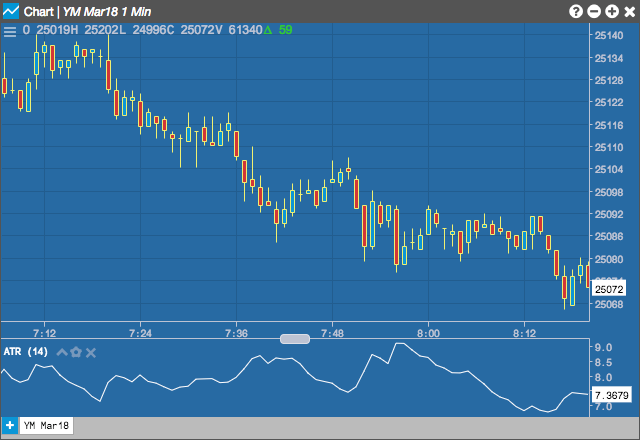
The Average True Range (ATR) study measures the size of the period's range, and takes into account any gap from the close of the previous period.
Configuration Options
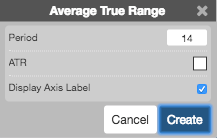
- Period: Number of bars to use in the calculations.
- Color Selectors: Colors to use for graph elements.
- Display Axis Label: Whether to display the most recent value on the Y axis.
Formula
\[Average\;True\;Range = average(TR, n)\]
where:
- \(TR = max(High_{t} - Close_{t-1}\;,\;Close_{t-1} - Low_{t}\;,\;High_{t} - Low_{t})\)
- \(n = period\)