Charts
ATR Trailing Stops
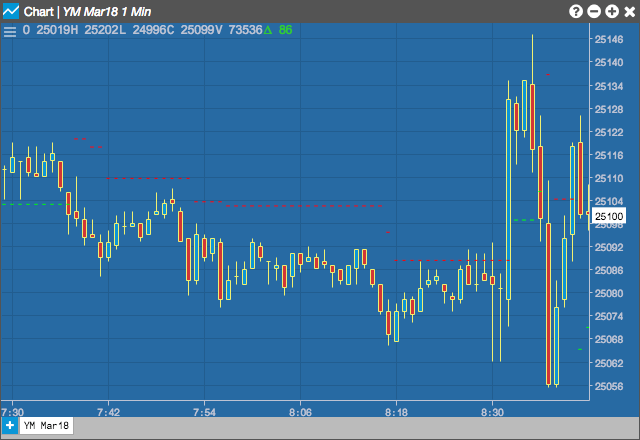
The ATR Trailing Stops indicator sets trailing stops to close positions based on the average true range. Wider stops indicate more volatility, while narrower stops indicate less volatility.
Configuration Options
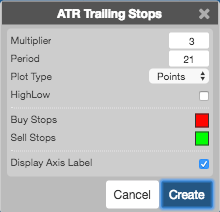
- Multiplier: Multiples vary between 2.5 and 3.5 ATR, with 3 being the default.
- Period: Number of bars to use in the calculations. ATR typically uses between a 5- and 21-period span.
-
Plot Type: Format for the stop, which can be set by setting the plot type to:
- Points
- Squarwave
- HighLow: The High/Low option bases the stop on the previous period’s high for up trends and previous period’s low for down trends.
- Color Selectors: Colors to use for graph elements.
- Display Axis Label: Whether to display the most recent value on the Y axis.
Formula
TR (True Range) is defined as the greatest of the following:
- Current high minus the current low
- Current high minus the previous close (absolute value)
- Current low minus the previous close (absolute value)
ATR = simple moving average of TR