Automated Collusive Spoofing
Automated collusive spoofing is an attempt by two or more traders to use automated trading strategies to deceive the market into thinking that an instrument has more interest, liquidity, or depth. For example, one trader's automated strategy will submit large orders on one side for the purpose of having the other trader's strategy execute smaller orders on the opposite side. Once the smaller orders are filled, the first automated strategy cancels the larger orders.
Note:The Automated Collusive Spoofing Model in TT Score is specifically tuned for automated trading strategies and detects potential spoofing activity in manual or mixed trading. Only trading events marked as originating from automated strategies in FIX Tag 1028 are clustered and scored under this model. Any clusters that contain trading events that are not marked as originating from automated trading strategies in FIX Tag 1028 are still found in the Spoofing or Collusive Spoofing models.
Automated collusive spoofing patterns
TT Score detects a variety of collective spoofing patterns, including:
- Simple spoofing: An automated trading strategy places a small order on one side (intent side) of the market that the user wants to execute, followed by a much larger order on the other side (spoof side) of the market to mislead another trader into executing against the smaller order.
- Spoofing with layering: An automated trading strategy places a small order on the intent side of the market and submits orders at multiple price levels on the spoof side of the market. These spoof-side orders are designed to create a false impression of liquidity so that other participants execute against the smaller intent-side order. Once filled, all spoof-side orders are canceled or modified to avoid execution.
- Spoofing with vacuuming: An automated trading strategy places a small order on one side of the market and a larger order on the same side of the market. The larger spoof order is then canceled to entice market movement toward the smaller order.
- Collapsing of layers: An automated trading strategy tries to create a false appearance of large volume by circumventing pre-trade individual order size limits. The automated trading strategy places a small order on the intent side and several small orders at a variety of price levels on the spoof side. The small individual spoof-side orders are then modified to the same price level to imply more volume at that price level.
- Flipping: An automated trading strategy places orders on one side of the market with the intent to switch, or flip, to the other side of the market. In this pattern, the automated trading strategy places a large spoof-side order at or near one side of the inside market to create a false impression of market depth, hoping to induce others to place orders on the same side at the same price point. Then the automated strategy simultaneously cancels the spoof-side orders and flips the order from buy to sell (or vice versa) to execute against the other participants.
- Spread squeezing: This spoofing pattern is unique to instruments with spreads that are multi-tick wide. An automated trading strategy places an order on the spoof-side at successively higher or lower prices with the spread to squeeze it one direction, enticing other market participants to join or beat the newly established top of book. The automated trading strategy then switches sides and executes against those participants. After execution, the trader cancels the spoof-side orders, and the market returns to its previous state. The automated trading strategy then uses the same squeeze technique on the opposite side of the trade to trade out of the established position at an advantageous price.
Scoring methodology
TT Score computes a cluster score based on how similar the activity in the cluster matches trading activity that has drawn regulatory attention in other situations.
Higher scores indicate the trading activity within a cluster is more likely to risk regulatory concern. A company's risk monitors can use these scores to prioritize resources for investing which users' trading activity poses the most regulatory risk.
Score interpretation
For the automated collusive spoofing pattern, each cluster is assigned a risk score on a sliding scale between 0-100. This score represents the probability that spoofing occurred during the duration of the cluster's trading activity.
Based on TT Score best practices, clusters that score over 75 are deemed to be “high risk” and should be the primary focus of users during their compliance reviews.
Scorecard metrics
The metrics for the Collusive Spoofing model combine the total activity of all traders. The ladder data aggregates volume from all the traders in the cluster.
The Scorecard Metrics section measures the following statistics related to collusive spoofing:
- Placed Buy Volume
- Placed Sell Volume
- Filled Buy Volume
- Filled Sell Volume
- Ord Cancel/Placed
- Ord Modify/Placed
- Volume Cancel/Placed
- Volume Modify/Placed
Identifying spoofing with the Automated Collusive Spoofing Model
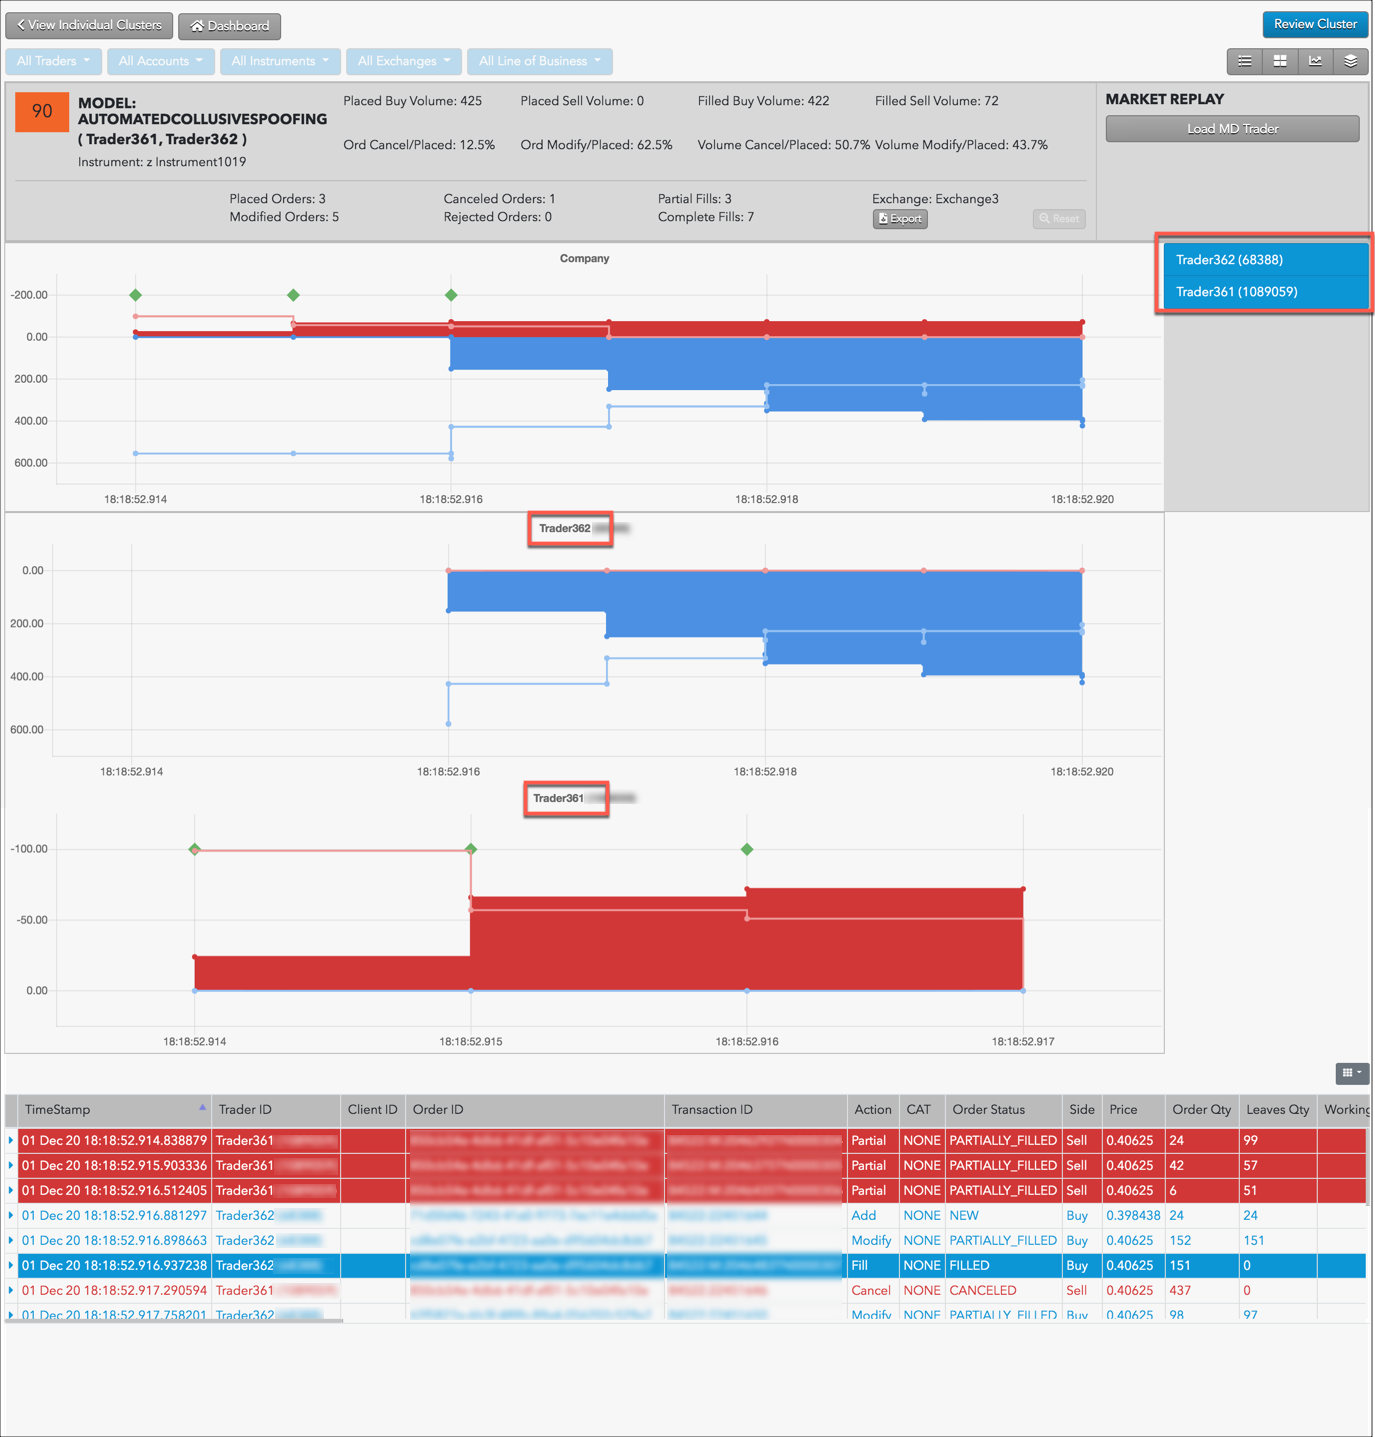
Use the Cluster Scorecard to identify the specific trading activity that triggered the automated collusive spoofing score. The pressure chart in the scorecard shows the company level or aggregate trading activity for the trader IDs identified in the cluster. Click a trader ID in right side of the chart to display that individual trader's activity in relation to the aggregate trading activity for the "company" shown in the top chart.
Automated Collusive Spoofing Examples
The chart contains visual clues about the automated collusive spoofing pattern. For example, the following chart is for a high scoring cluster that shows a simple spoofing pattern involving three traders.
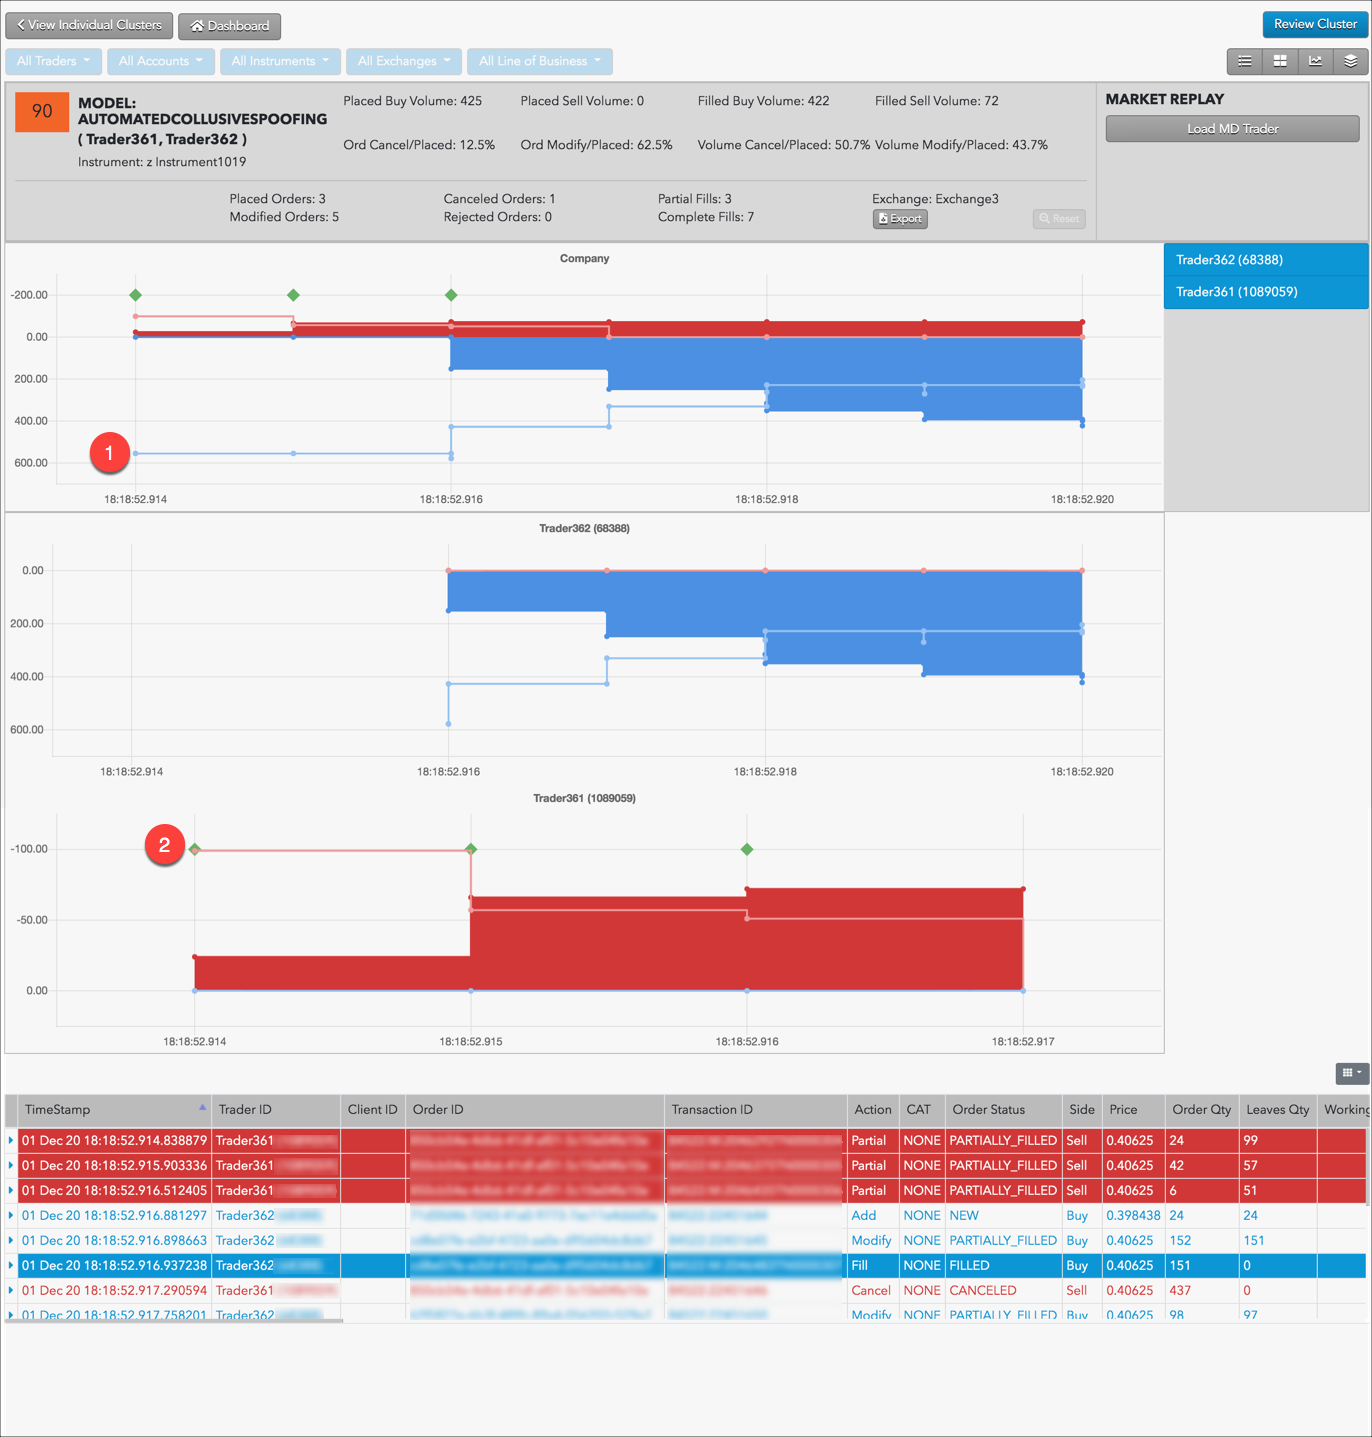
In this example:
- An automated trading strategy adds resting bid quantities showing buy-side pressure.
-
A second automated trading strategy submits smaller offer orders and gets filled.
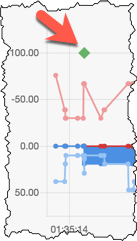
Note: The green diamond above the fill is an "imbalanced fill indicator" that marks where a trader receives a fill on the opposite side of the majority of their working volume.
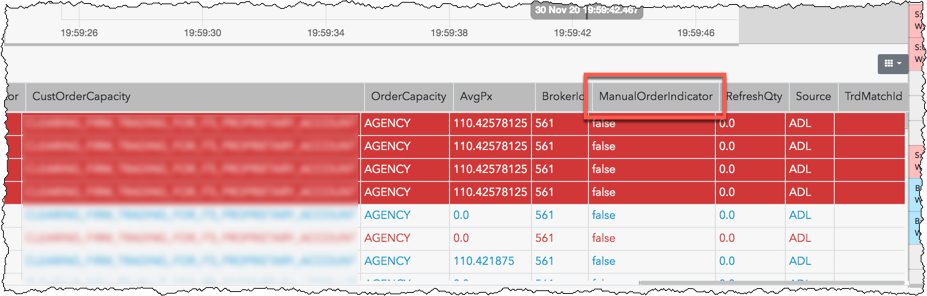
In the Audit Trail, the ManualOrderIndicator column displays "false" (Tag 1028=N) indicating the orders were submitted by the traders using an automated trading strategy.
The chart in the scorecard shows activity based on order volume over time, but does not show prices and liquidity. Looking at the prices for the potential spoofing orders can help you determine whether the automated trading strategy was placing those orders far off the market in an attempt to deceive traders.
In the Cluster Scorecard, you can click Market Replay to view how orders interacted with the market at various price levels.
For example, you can see in the replay when the automated trading strategy begins submitting and canceling large Buy or Sell orders to create the illusion of buy-side or sell-side pressure. As you continue replaying the market activity, you can observe the state of the market and the trader's activity at each point in time.
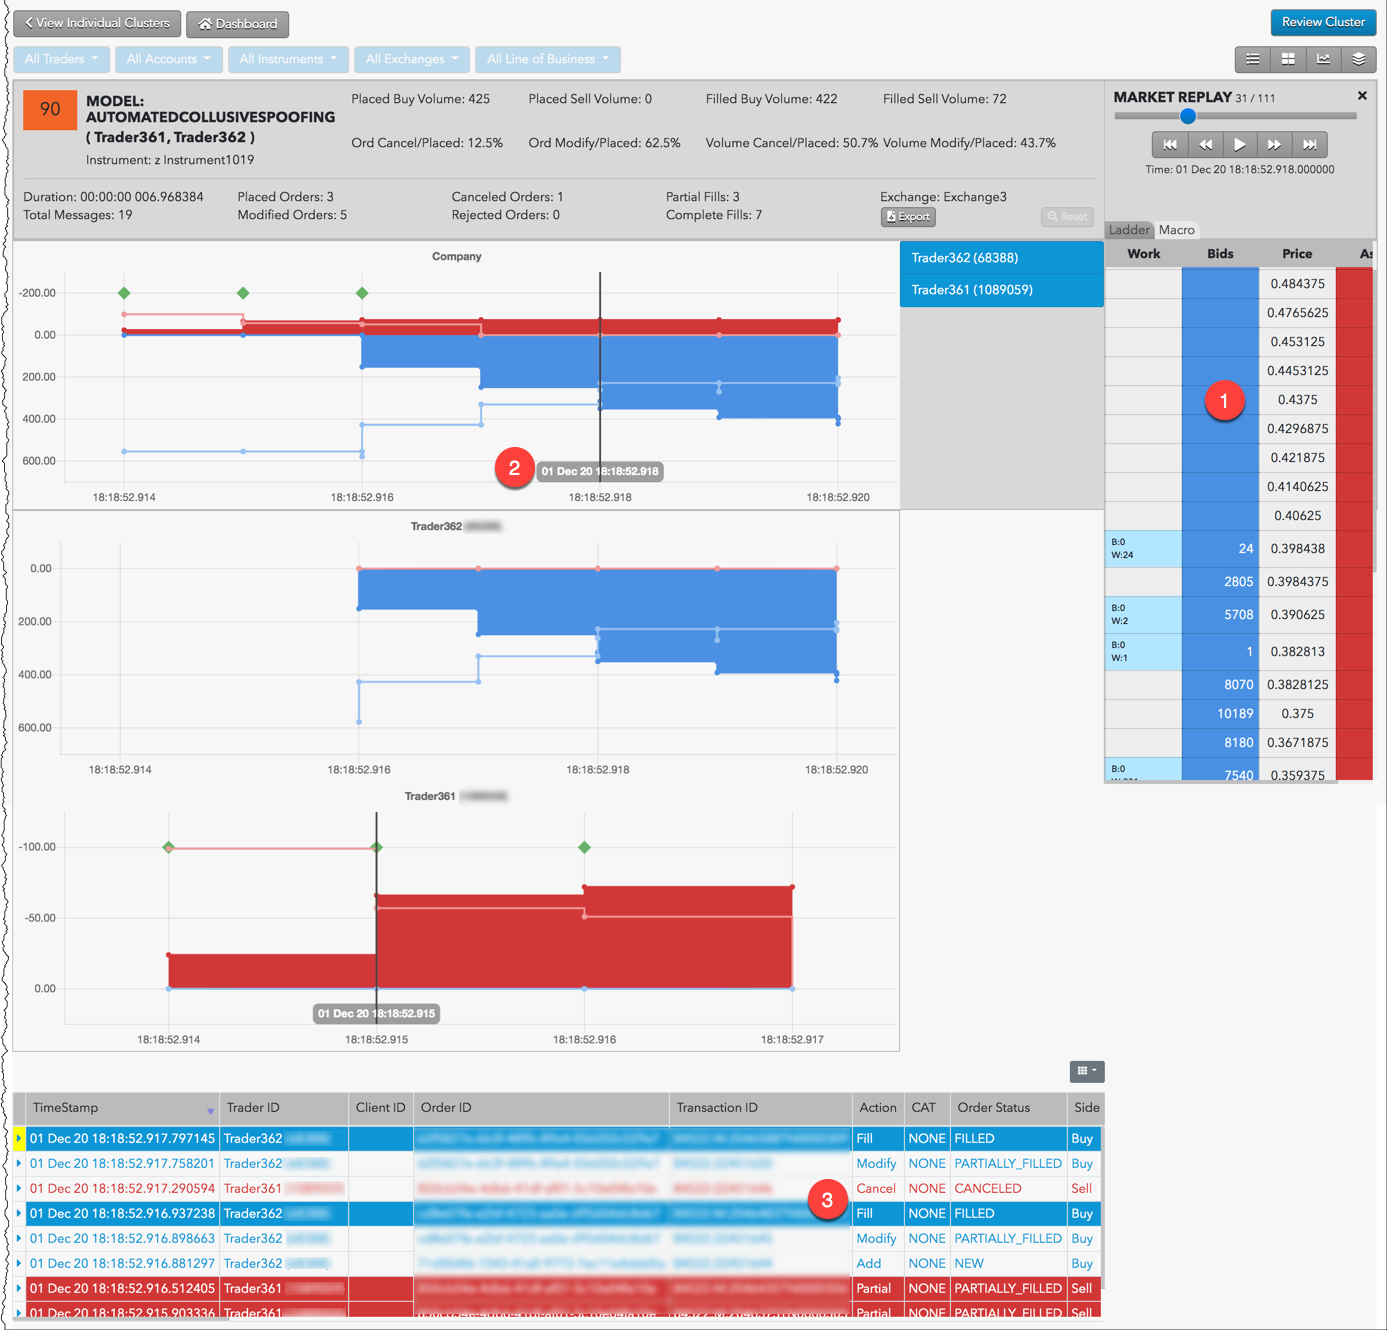
In this example:
- The price ladder shows the prices and liquidity in the market during the potential spoofing activity by an automated trading strategy.
- The vertical line identifies the point in time when the trading occurred.
- Orders and fills that occurred around the specified time are also displayed.
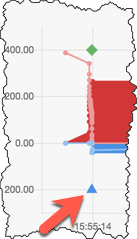
Spoofing Indicators
The chart on the Cluster Scorecard may also show "imbalanced fill" and "market flip" indicators to help easily identify when the potential spoofing occurred.
The imbalanced fill indicator is a green diamond above a fill that indicates where the trader had an imbalance between the bid and offer and was filled on orders on the small side of the imbalance.
The market flip indicator shows where a trader quickly flipped from offering to bidding (or vice versa) at the same price. The triangle indicator is either red (flipped short) or blue (flipped long).