Vol Curve Manager
Displaying volatility curves
To display the volatility curve for a specific point in time,
-
Ensure the Historical chart selection is enabled.
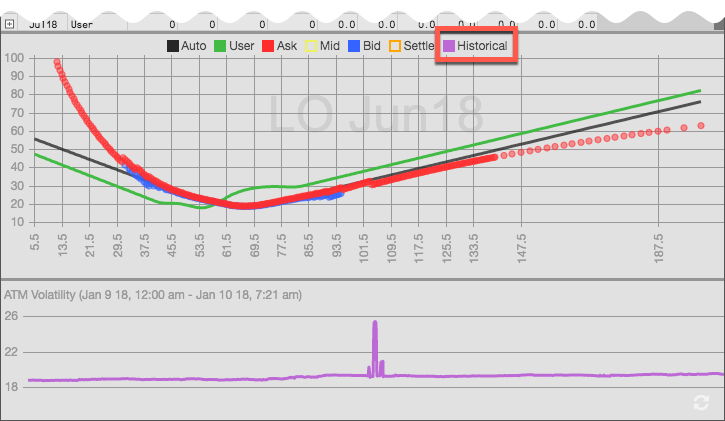
-
Click at a point on the ATM Volatility curve shown in the bottom of the widget to show the historical volatility curve at the selected time, which is displayed in the graph area.
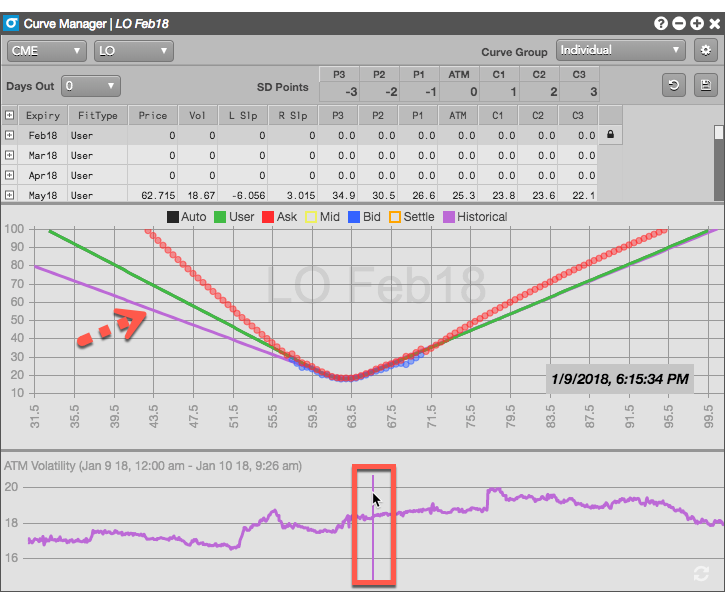
To display the changes in the volatility curve over the current and previous sessions, click in the bottom pane and drag the mouse across the various data points. The historical vol curve updates dynamically as you move the cursor across data points.
