RFQ Viewer
RFQ Viewer reference
Context menu settings
Right-click in the title bar of the RFQ Viewer to open the context menu, which contains the following widget-specific items in addition to the common context menu items:
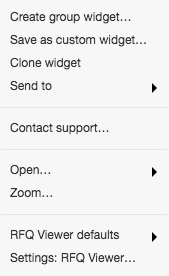
- RFQ Viewer defatuls
- Save as RFQ Viewer defaults — Saves your current settings as the default settings for all RFQ Viewer widgets.
- Reset RFQ Viewer defaults — Restores your previous RFQ Viewer widget settings.
Available settings
These settings affect only the selected RFQ Viewer widget. To update the default settings with these value for newly-opened RFQ Viewer widgets, or to apply them to existing opened widgets, click Defaults.
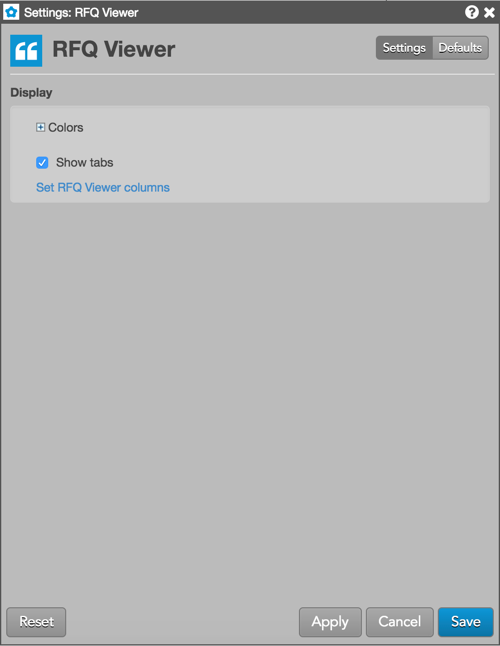
Display section
-
Grid font size: Adjust the font size to suit your preferences and use bold text, if desired.
-
Colors: Allows you to customize or change the cell and column colors available in the widget.
-
Show tabs: Check to show tabs at the bottom of the widget. Uncheck to hide tabs.
-
Set RFQ Viewer columns: Select the columns you want shown in the widget.
RFQ Viewer column descriptions
| Column | Description |
|---|---|
| Ask | The best market ask price. |
| AskQty | The total quantity working at the ask. |
| Bid | The best market bid price. |
| BidQty | The total quantity working at the bid. |
| Buy Edge | Difference between the best ask and the theoretical value. |
| Contract | The name and contract expiry for the instrument or strategy. |
| Elapsed | The time the RFQ has been available in the market. |
| IV | Implied volatility value. Implied volatilities are calculated using the midpoint of bid and ask prices. |
| Γ/Θ | Is a measure of how much money you will gain by owning the option due to movements in the underlying versus how much money you will lose in time decay (theta). Also known as epsilon. |
| IRho | Shows the change in options value per change in interest rate. Based on TT auto-fit volatility curve values. |
| IVega | Shows the change in options value per change in volatility based on the TT auto-fit volatility curve. |
| ITheta | Shows the change in options value per change in time, which is also known as time decay. Based on TT auto-fit volatility curve values. |
| IGamma | Gamma calculated using implied volatility. |
| IΔ | The delta calculated with the auto-fit volatility curve values provided by TT. |
| MDT | Button to launch the contract in the MD Trader widget. |
| Pin | Moves and pins the RFQ to the top of the list in the viewer. |
| Re-RFQ | Resends the RFQ and moves it to the top of the list in the viewer. |
| Qty | Shows the requested quantity if it's submitted with the RFQ for a contract. |
| Sell Edge | Difference between the best bid and the theoretical value. |
| Side | Shows whether the transaction is a Buy or Sell. For an RFQ, this column shows the side of the trade if it's submitted with the RFQ for a contract. |
| Time | The time that the RFQ was submitted for the instrument. |
| Term | Shows the contract month for a strategy. If all contracts in a strategy are in the same month, that month is listed in the Term column. If not, then just the front month of the strategy is listed. |
| U TV | The theoretical value of the instrument based on the user's volatility curve. |
| TT TV | The TT calculated theoretical value based on the auto-fit volatility curve values. |
| Type | The type of the options strategy or instrument. |
| UV | User volatility values that are used for calculating theoretical call and put values. These user-defined vols are entered using the Vol Curve Manager, which fits the curve to the control points on the volatility curve. The user volatility values are a result of the fitting process. |
| URho | Shows the change in options value per change in interest rate. Based on user-defined volatility curve values. |
| UVega | Shows the change in options value per change in volatility based on the user-defined volatility curve. |
| UTheta | Shows the change in options value per change in time, which is also known as time decay. Based on user-defined volatility curve values. |
| UGamma | Gamma calculated using the user-defined volatility. |
| UΔ | Delta calculated using the user-defined volatility. |
| WrkBuys | The total quantity of working buy orders for an instrument. If market depth is displayed, the working quantities are displayed for each price. Columns display the quantities of and floating order book access to working orders. If market depth is displayed, the working quantities are displayed for each price. |
| WrkSells | The total number of working orders at the ask price. At the best ask price, the total number of working sell orders for all levels of depth is also displayed. Columns display the quantities of and floating order book access to working orders. If market depth is displayed, the working quantities are displayed for each price. |
| Volume | The total traded quantity for the session. |